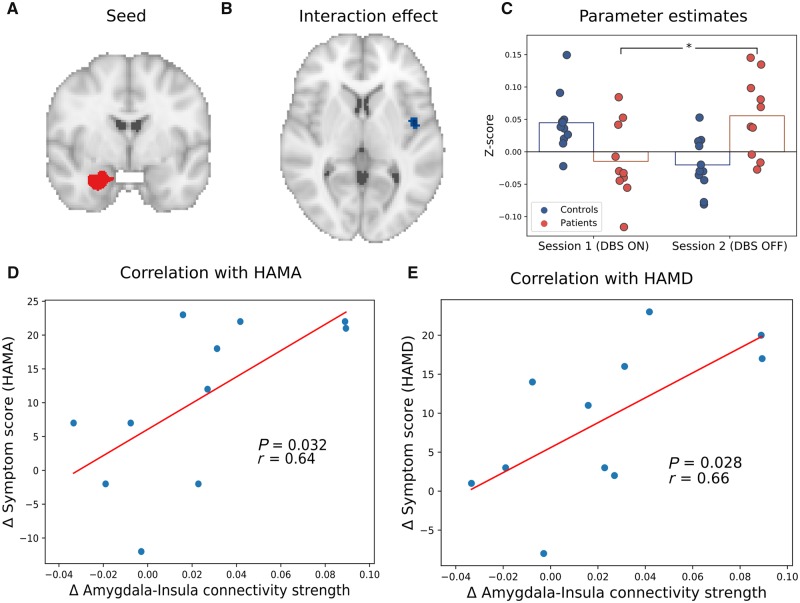
Figure 2.
The effects of DBS on functional connectivity of the laterobasal amygdala with the insula. (A) The left laterobasal amygdala seed region. (B) The significant interaction cluster in the right insula. (C) Parameter estimates for the significant interaction cluster (for illustrative purposes). (D) Correlation between changes in laterobasal amygdala-insula connectivity and HAM-A scores in OCD patients. The blue dots are data from each patient while the red line is a fitted regression line. (E) Correlation between changes in laterobasal amygdala-insula connectivity and HAM-D scores in OCD patients. *P < 0.05.

