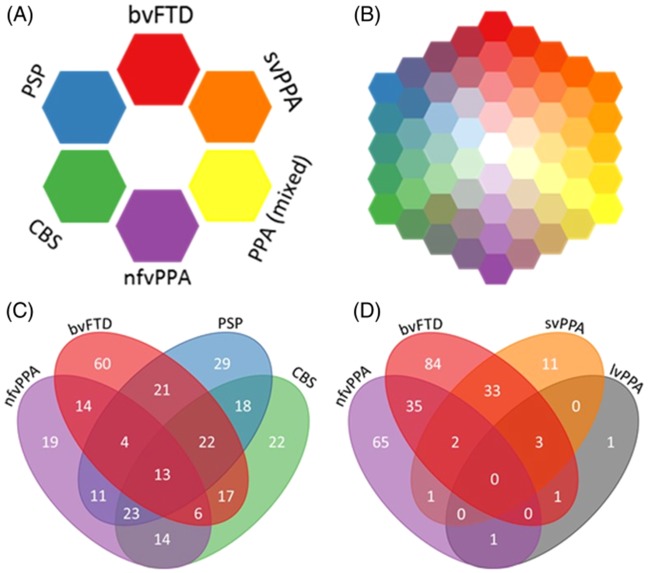
Figure 1.
The FTLD syndrome spectrum. (A) Schematic of current diagnostic criteria. (B) Schematic to highlight our hypothesis that FTLD syndromes occur on a spectrum. (C and D) Four-way Venn diagrams of overlap between FTLD syndromes in the study. The numbers in each oval refer to the number of patients who met the diagnostic criteria for those syndromes. Many patients met the diagnostic criteria for two or more syndromes. (C) Overlap between bvFTD, nfvPPA, PSP and CBS. (D) Overlap between bvFTD, nfvPPA, svPPA and lvPPA.

