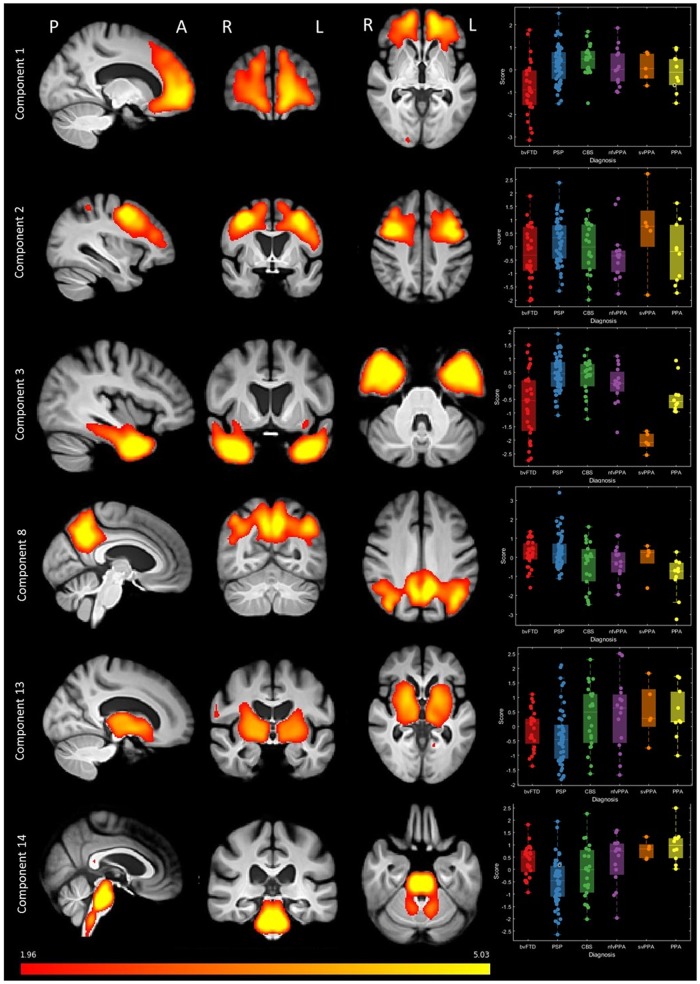
Figure 5.
Source-based morphometry (based on independent component analysis) of combined grey and white matter. A subset of components is shown (all components are provided in the Supplementary material). Fifteen components were selected, each representing a region of independently covarying grey and white matter atrophy. Images are standardized group spatial maps for each component, superimposed on an average of all brain images. The scatter-box plots show the standardized subject loading coefficients, grouped by FTLD syndrome subtype.

