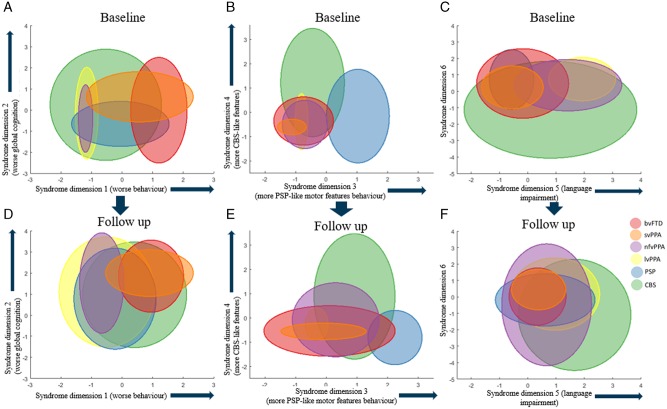
Figure 7.
Longitudinal phenotype information. A subset of patients was assessed at two time points. Three arbitrary pairs of syndrome dimensions are given to illustrate the convergence of clinical phenotype in syndrome dimensions at follow-up. Each ellipse shows the 95% confidence intervals of the syndrome dimension scores for each FTLD subgroup at baseline and follow-up. At follow-up there was greater overlap across all FTLD syndromes in all syndrome dimensions.

