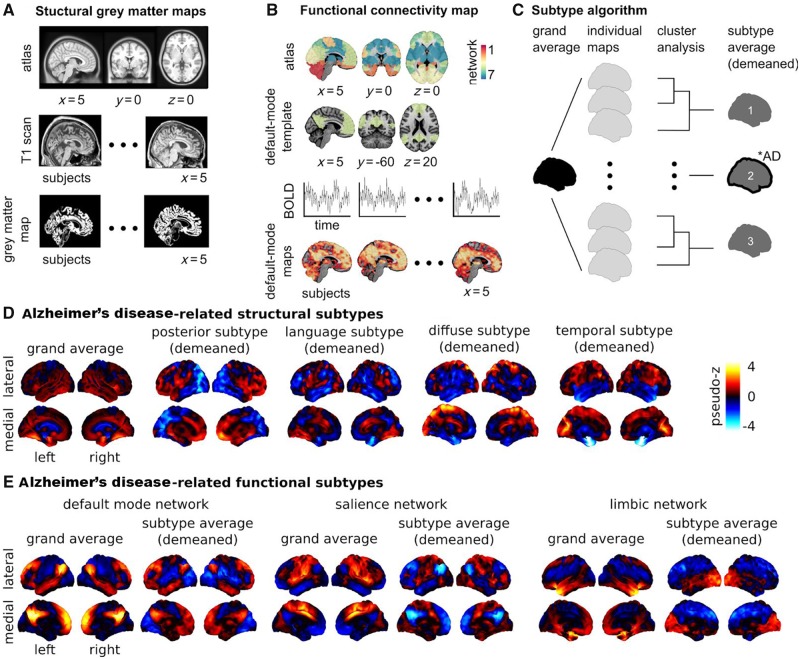
Figure 1.
Brain morphology and connectomics Alzheimer’s disease-related subtypes. Neuroimaging provides insight into the effect of neurodegeneration on brain health. There exist different tools that can capture distinct, yet complementary, aspects of brain structure and function. The most established neuroimaging marker of neurodegeneration is grey matter atrophy, measured by structural MRI. Structural MRI is a non-invasive technique widely used in both research and clinical practice. To generate structural maps, individual structural MRI scans are first spatially aligned to a reference template or atlas (A). Then for each individual and each voxel (smallest volume element in MRI data), a metric characterizing the local structure of the grey matter is generated, such as (A) grey matter volume, cortical thickness or surface area. Using these approaches, it is possible to monitor the thinning of grey matter, which likely reflects the death of neuronal cell bodies at advanced stages of neurodegeneration. Synaptic disruption is an early event in Alzheimer’s disease (Sperling et al., 2011), and functional networks may have the ability to compensate the impact of neurodegeneration on cognitive symptoms (Franzmeier et al., 2017). For these reasons, intrinsic functional connectivity from resting state functional MRI is an emerging Alzheimer’s disease biomarker that holds promise for early diagnosis (Sperling et al., 2011; Badhwar et al., 2017). To analyse resting state functional MRI, select regions in canonical brain networks previously established in the literature are generally considered (B). An individual resting state functional MRI connectivity map can be generated for different networks, with the default mode, limbic, and salience networks being the key components affected by Alzheimer’s disease (Badhwar et al., 2017) (B). Structural and functional brain maps can enter a subtyping procedure, which identifies groups of individuals with homogeneous brain maps (C).The number of subtypes are defined a priori or through various metrics for model selection (Seghier, 2018), for example n = 3 in C. A subtype map is generated by averaging the maps within each subgroup and subtracting the grand average (i.e. demeaned) to emphasize the features of the subtype. Chi square statistics are applied to identify groups that include a greater number of Alzheimer’s disease patients than expected by chance (illustrated by a ‘*AD’ annotation for subtype 2 in C). (D) The subtyping procedure was applied on maps of grey matter density from cognitively normal and Alzheimer’s disease dementia individuals in the ADNI database (n = 377). Four of seven subtypes were identified as Alzheimer’s disease dementia-related (results adapted from Tam et al., 2019). Three subtypes were consistent with previous reports: posterior (or temporo-occipito-parietal-predominant), diffuse, and temporal (or medial temporal-predominant) atrophy subtypes. A novel language atrophy subtype was also identified. (E) The subtype procedure was applied to resting state functional MRI data collected on cognitively normal, MCI, and Alzheimer’s disease dementia individuals in a dataset pooling ADNI2 with several independent samples (n = 130). Three subtypes were extracted for three resting state networks known to be impacted by Alzheimer’s disease: default mode, salience, and limbic (Badhwar et al., 2017). One Alzheimer’s disease dementia/MCI-related subtype was found for each network. The salience and default mode followed similar patterns: increased within-network connectivity, and a lower (negative) connectivity between networks. The limbic subtypes showed lower connectivity with frontal regions, and increased connectivity with occipital regions. Results adapted from Orban et al. (2017b). The section on ‘Brain subtypes’ compares results from the abovementioned and other studies with similar approaches and objectives. Supplementary Table 1 provides detailed characteristics of the 12 neuroimaging subtyping studies (structural MRI and resting state functional MRI) that met our search criteria. BOLD = blood oxygenation level-dependent signal.

