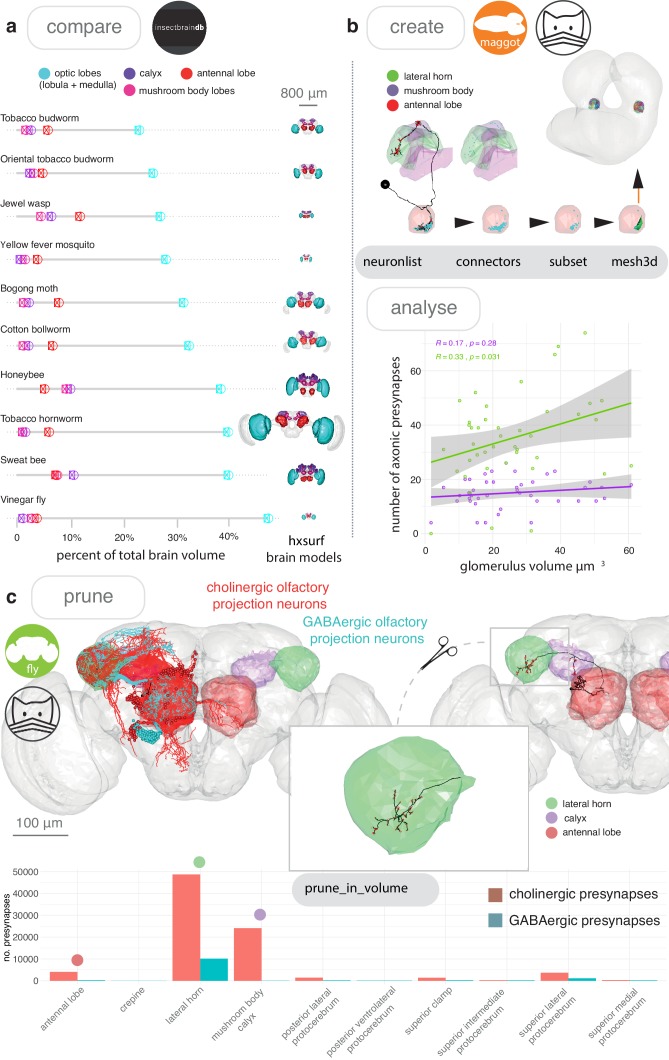
Figure 3. Neuroanatomical models with nat.
(a) We accessed the InsectBrainDB.org via insectbrainr to obtain template brains for different species of insect (Brandt et al., 2005; de Vries et al., 2017; El Jundi et al., 2018; Heinze and Reppert (2012); Kurylas et al. (2008); Løfaldli et al. (2010); Stone et al. (2017); Zhao et al., 2014). The package insectbrainr converts retrieved OBJ files into hxsurf objects, which contain one set of 3D points for each whole brain, and then different sets of edges between these points to form 3D neuropil subvolumes. These subvolumes were already defined by expert annotators. Their volume are compared across insect brain, normalised by total brain size. Insect template brain data curated by: S. Heinze, M. Younger, J. Rybak, G. Pfuhl, B. Berg, B. el Jundi, J. Groothuis and U. Homberg. (b) We can create our own subvolumes by pulling synaptic neuron reconstructions (Berck et al., 2016) from a first-instar larva EM dataset (Ohyama et al., 2015) (a public CATMAID instance hosted by Virtual Fly Brain), extracting dendritic post synapses from olfactory projections neurons, and using synapse clouds from neurons of the same cell type, to define glomerular volumes by creating a bounding volume, i.e an α-shape or convex hull. Their volumes can then be calculated, and correlated with the number of presynapses the same neurons make in two higher-order brain regions, the lateral horn and the mushroom body calyx. (c) Volumes can be used to analyse skeleton data. In (c) we look again at olfactory projection neurons, this time from an adult fly EM dataset (Zheng et al., 2018) and use the nat function pointsinside with standard neuropil volumes (Ito et al., 2014) to find the numbers of presynapses GABAergic and cholinergic olfactory projection neurons from the antennal lobe make in different neuropils. These neuropils exist as a hxsurf object in our R package nat.flybrains.


