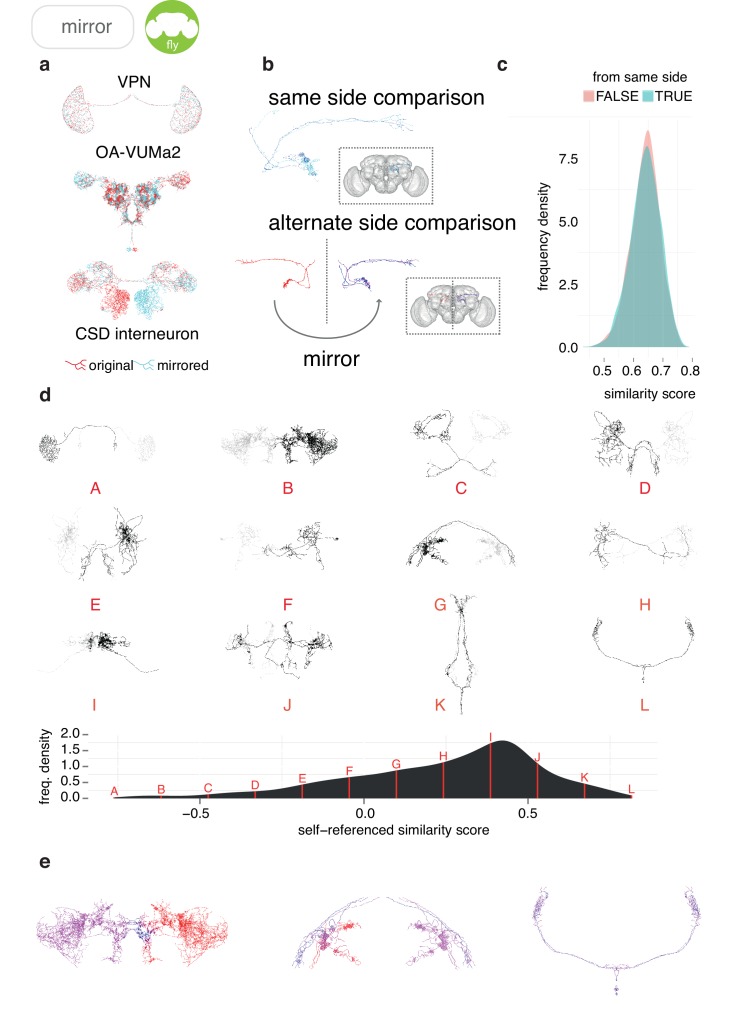
Figure 5. Sample applications of mirroring registrations.
(a) Three FlyCircuit neurons along with mirrored versions; a visual projection neuron, OA-VUMa2 (Busch et al., 2009) and the CSD interneuron (Dacks et al., 2006). Co-visualisation facilitates the detection of differences in innervation, such as the higher density of innervation for the CSD interneuron in the lateral horn on the contralateral side compared to the ipsilateral lateral horn. (b) Neurons from the same side of the brain and alternate side of brain are compared and a similarity score generated. (c) Distributions of similarity scores for comparisons within the same brain hemisphere and across brain hemispheres. These scores are similar, because the mirroring registration is good. (d) Sequence of 12 example neurons (black) with mirrored counterparts (grey), having equally spaced similarity scores. Below, full distribution of scores for all neurons in FlyCircuit dataset. (e) Segment-by-segment measures of neuron similarity. Redder shades correspond to low degrees of symmetricity, bluer shades higher. Flipped version of neuron in gray.


