. 2020 May 6;9:e55853. doi: 10.7554/eLife.55853

Figure 3. Cryo-EM analysis.

(A) Cryo-EM density of undecameric (11-mer) and decameric (10-mer) pairs of CALHM4 channels at 3.8 and 4.1 Å respectively. Data were recorded from a Ca2+-free sample. Subunits are colored in lilac and green, respectively. (B) Cryo-EM density of decameric CALHM6 channels at 4.4 Å. Subunits are colored in red and light-blue, respectively. A, B, Views are from within the membrane with membrane indicated as grey rectangle (top) and from the outside (bottom). (C) Selected 2D classes of the CALHM2 data showing interacting channel pairs and single channels viewed from within the membrane (top) and views of undecameric and dodecameric channels with subunits numbered (bottom). (D) Slices through the CALHM4 (left) and the CALHM6 (right) channels illustrating the distinct features of the cylindrical and conical pore conformations. View of CALHM6 at lower contour (right) shows extended density for the mobile TM1. Maps are low-pass filtered at 6 Å. Colored features refer to density corresponding to TM1 and NH.

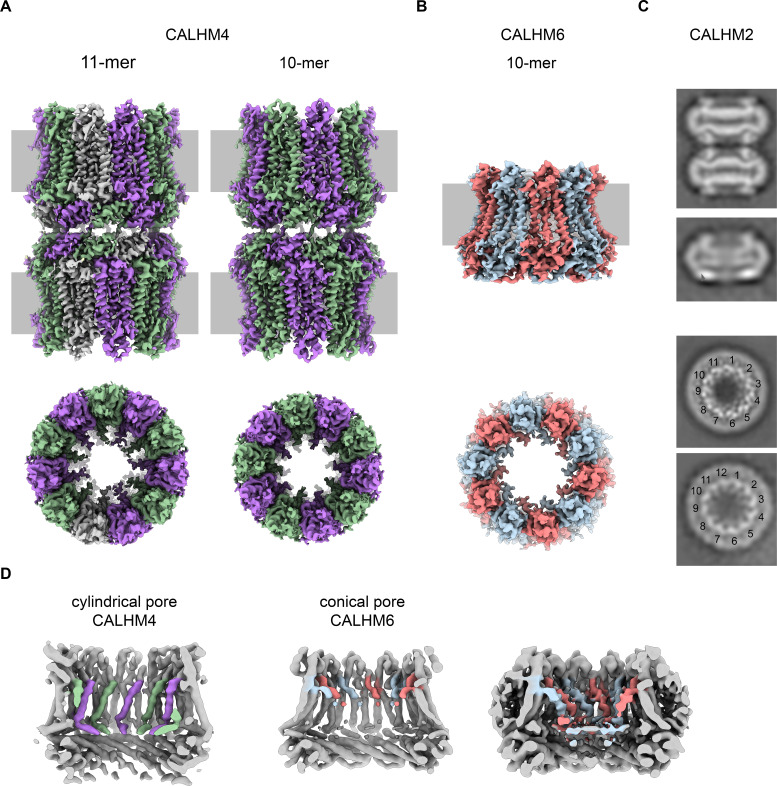
Figure 3.

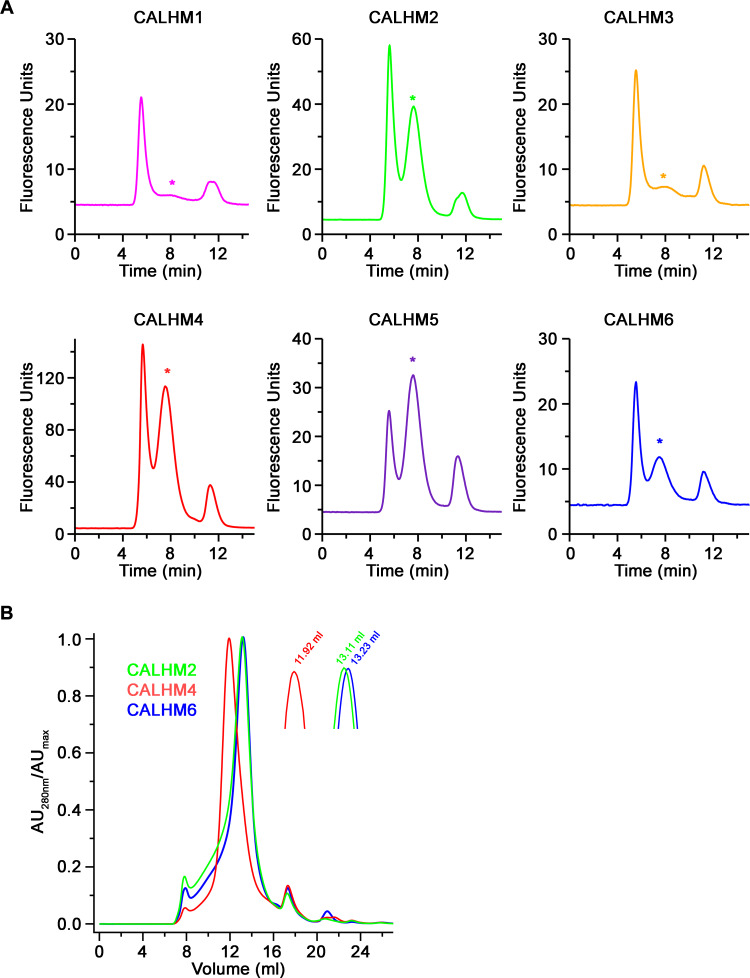
Figure 3—figure supplement 1. Biochemical characterization.

Figure 3—figure supplement 1.

(A) Size-exclusion chromatograms recorded from fluorescently tagged CALHM subunits from a whole-cell extract in the detergent GDN on a Superose 6 5/150 column at a flow rate of 0.2 ml/min. Asterisks indicate elution times for each paralog. (B) Overlay of size-exclusion chromatograms recorded from purified CALHM paralogs after cleavage of the fusion peptide used for cryo-EM analysis on a Superose 6 10/300 column. Inset shows magnified peak region with respective elution volumes indicated.
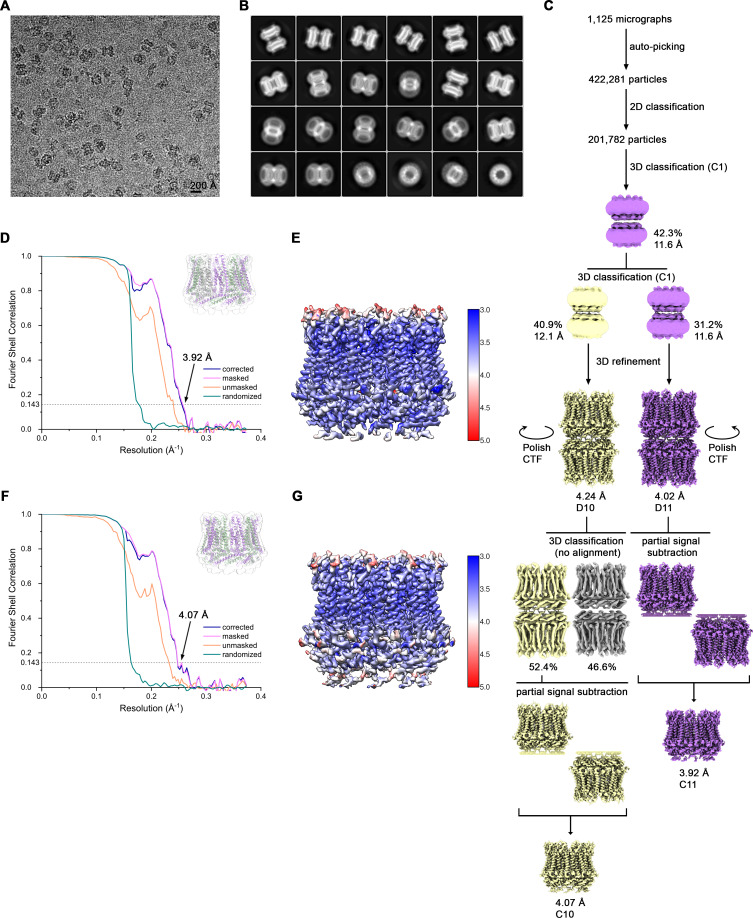
Figure 3—figure supplement 2. Cryo-EM reconstruction of CALHM4 in presence of Ca2+.

Figure 3—figure supplement 2.

(A) Representative cryo-EM micrograph acquired with a Tecnai G2 Polara microscope. (B) 2D class averages of CALHM4 in presence of Ca2+. (C) Data processing workflow. Two rounds of non-symmetrized 3D classification allowed to isolate two populations representing decameric and undecameric assemblies. The particles were further refined with either D10 or D11 symmetry imposed. After performing per-particle CTF refinement and Bayesian polishing, the remaining structural heterogeneity in decamers was segregated by performing the final 3D classification, where the orientations were kept fixed as in the consensus model. To further improve the resolution of each reconstruction, partial signal subtraction followed by 3D refinement was applied. Particles with the symmetry relaxed to either C10 or C11 were merged and subjected to a final round of auto-refinement. The distribution of all particles (%) and the resolution of each class is indicated. (D) FSC plot of the final refined undecameric unmasked (orange), masked (pink), phase-randomized (green) and corrected for mask convolution effects (blue) cryo-EM density map of CALHM4. The resolution at which the FSC curve drops below the 0.143 threshold is indicated. The inset shows the atomic model within the mask that was applied for calculations of the resolution estimates. (E) Final 3D reconstruction of undecameric CALHM4 colored according to local resolution. (F) FSC plot of the final refined decameric unmasked (orange), masked (pink), phase-randomized (green) and corrected for mask convolution effects (blue) cryo-EM density map of CALHM4. The resolution at which the FSC curve drops below the 0.143 threshold is indicated. The inset shows the atomic model within the mask that was applied for calculations of the resolution estimates. (G) Final 3D reconstruction of decameric CALHM4 colored according to local resolution.
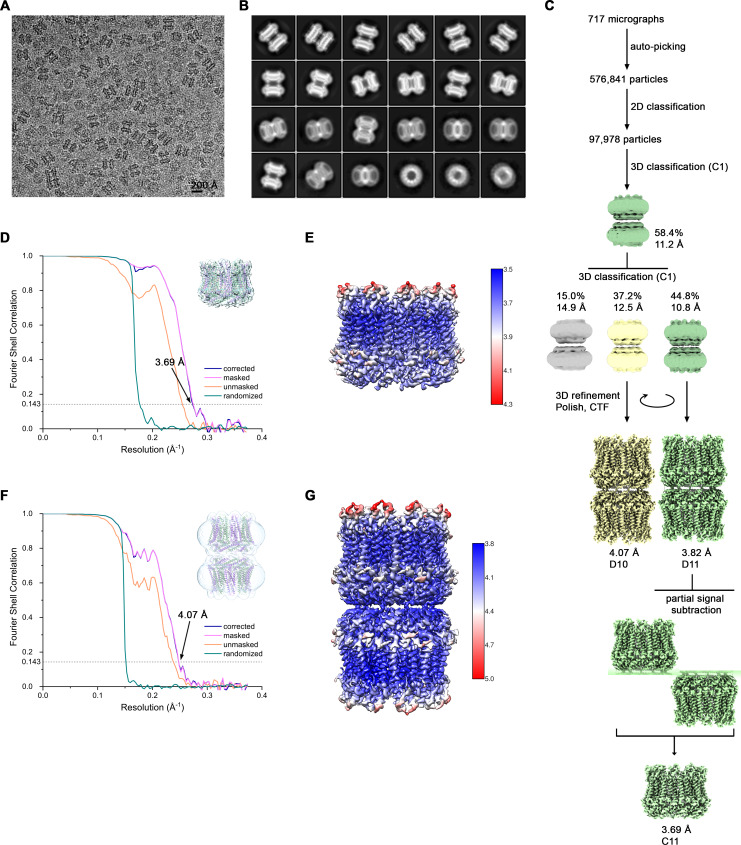
Figure 3—figure supplement 3. Cryo-EM reconstruction of CALHM4 in absence of Ca2+.

Figure 3—figure supplement 3.

(A) Representative cryo-EM micrograph acquired with a Tecnai G2 Polara microscope. (B) 2D class averages of CALHM4 in absence of Ca2+. (C) Data processing workflow. Two rounds of non-symmetrized 3D classification allowed to isolate two populations representing decameric and undecameric assemblies. The particles were further refined with either D10 or D11 symmetry imposed and iterative per-particle CTF refinement and Bayesian polishing. The resolution of the undecameric assembly was further improved by partial signal subtraction followed by 3D refinement with C11 symmetry applied. The distribution of all particles (%) and the resolution of each class is indicated. (D) FSC plot of the final refined undecameric unmasked (orange), masked (pink), phase-randomized (green) and corrected for mask convolution effects (blue) cryo-EM density map of CALHM4. The resolution at which the FSC curve drops below the 0.143 threshold is indicated. The inset shows the atomic model within the mask that was applied for calculations of the resolution estimates. (E) Final 3D reconstruction of undecameric CALHM4 colored according to local resolution. (F) FSC plot of the final refined decameric unmasked (orange), masked (pink), phase-randomized (green) and corrected for mask convolution effects (blue) cryo-EM density map of CALHM4. The resolution at which the FSC curve drops below the 0.143 threshold is indicated. The inset shows the atomic model within the mask that was applied for calculations of the resolution estimates. (G) Final 3D reconstruction of decameric CALHM4 colored according to local resolution.
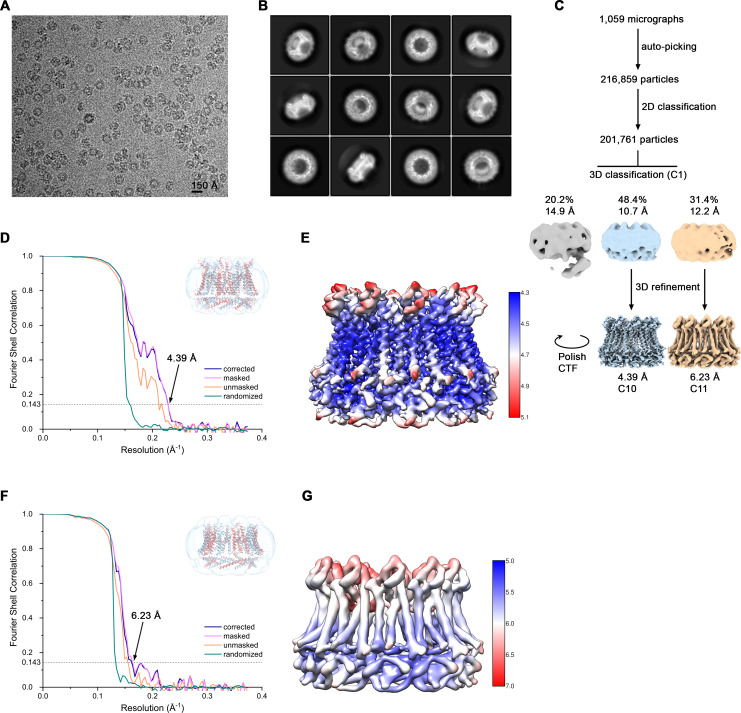
Figure 3—figure supplement 4. Cryo-EM reconstruction of CALHM6 in presence of Ca2+.

Figure 3—figure supplement 4.

(A) Representative cryo-EM micrograph acquired with a Tecnai G2 Polara microscope. (B) 2D class averages of CALHM6 in presence of Ca2+. (C) Data processing workflow. Non-symmetrized 3D classification allowed to isolate two populations representing decameric and undecameric assemblies. The particles were further refined with either C10 or C11 symmetry imposed and iterative per-particle CTF refinement and Bayesian polishing. The distribution of all particles (%) and the resolution of each class is indicated. (D) FSC plot of the final refined decameric unmasked (orange), masked (pink), phase-randomized (green) and corrected for mask convolution effects (blue) cryo-EM density map of CALHM6. The resolution at which the FSC curve drops below the 0.143 threshold is indicated. The inset shows the atomic model within the mask that was applied for calculations of the resolution estimates. (E) Final 3D reconstruction of decameric CALHM6 colored according to local resolution. (F) FSC plot of the final refined undecameric unmasked (orange), masked (pink), phase-randomized (green) and corrected for mask convolution effects (blue) cryo-EM density map of CALHM6. The resolution at which the FSC curve drops below the 0.143 threshold is indicated. The inset shows the atomic model within the mask that was applied for calculations of the resolution estimates. (G) Final 3D reconstruction of undecameric CALHM6 colored according to local resolution.
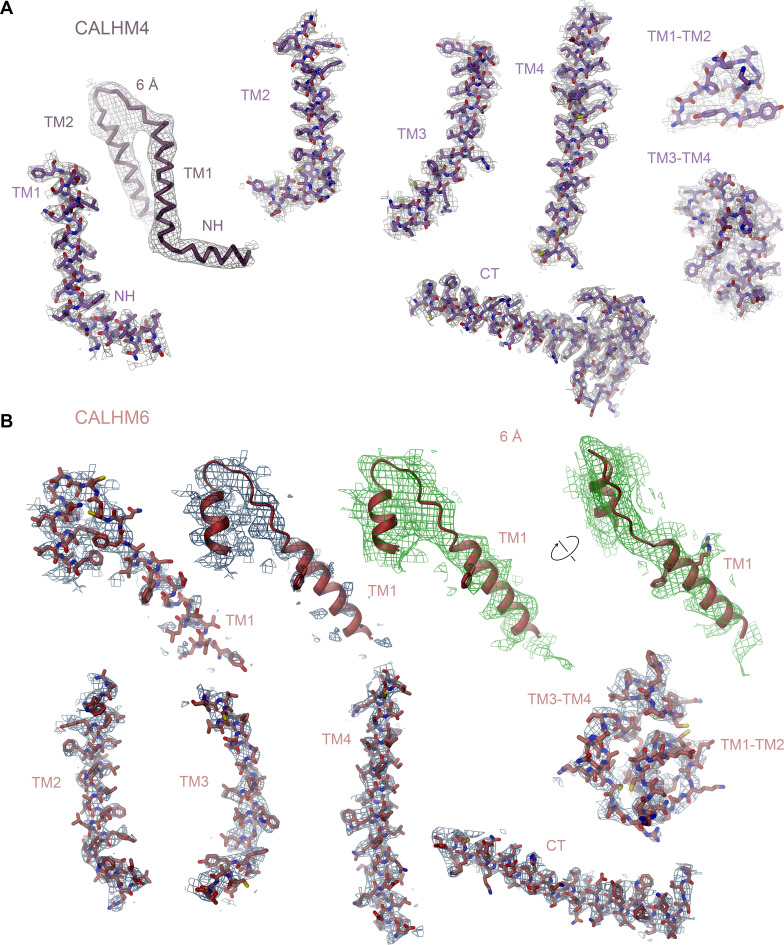
Figure 3—figure supplement 5. Cryo-EM density of CALHM4 and CALHM6.

Figure 3—figure supplement 5.

(A) Cryo-EM density at 3.7 Å of selected regions of the undecameric CALHM4 structure recorded from a sample obtained in the absence of Ca2+ superimposed on the model. Structural elements are indicated, ‘6 Å’ marks cryo-EM density low-pass filtered to 6 Å superimposed on a Cα trace of NH and TM1, which illustrates the helicity of the entire NH region that is partly not defined in the density at higher resolution due to its intrinsic mobility. (B) Cryo-EM density at 4.4 Å of selected regions of the decameric CALHM6 structure superimposed on the model. Structural elements are indicated. ‘6 Å’ marks cryo-EM density low-pass filtered to 6 Å superimposed on a ribbon of TM1 and parts of TM2, which displays extended density for the entire TM1 region that is partly not defined in the density at higher resolution due to its intrinsic mobility. Density is shown from two different views with indicated relationship. Large side chains that are recognizable in the low-pass filtered map are displayed as sticks.
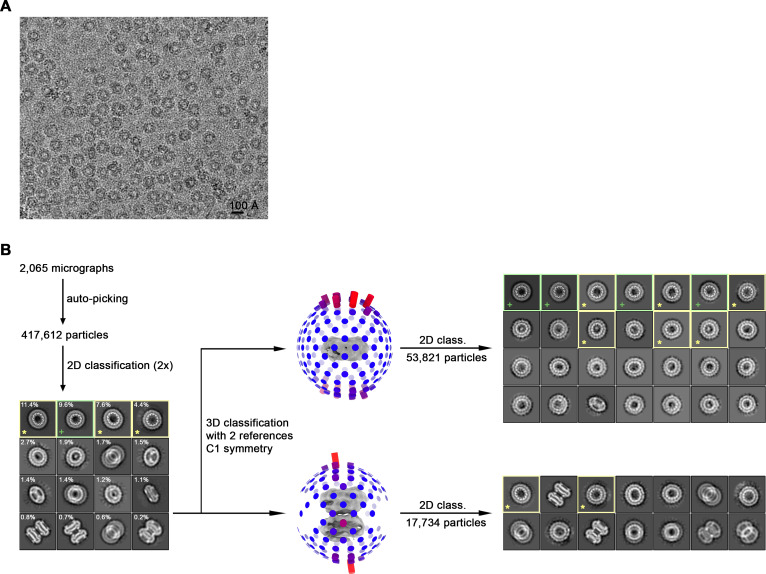
Figure 3—figure supplement 6. Cryo-EM reconstruction of CALHM2 in presence of Ca2+.

Figure 3—figure supplement 6.

(A) Representative cryo-EM micrograph acquired with a Tecnai G2 Polara microscope. (B) Data processing workflow. Non-symmetrized 3D classification with two reference models representing monomeric and dihedrally-related dimeric architectures as observed for CALHM6 and CALHM4, respectively, allowed to separate CALHM2 particles into two respective subsets. However, preferential orientation of the particles on a grid together with the presence of compositional heterogeneity in form of undecameric and dodecameric assemblies within each subset hindered generation of a high-resolution 3D reconstruction. 2D class averages calculated separately from monomeric and dimeric subsets highlight the predominance of views from the extracellular side. Green boxes and ‘+’ mark representative views of undecameric and yellow boxes and ‘*’ of dodecameric assemblies.