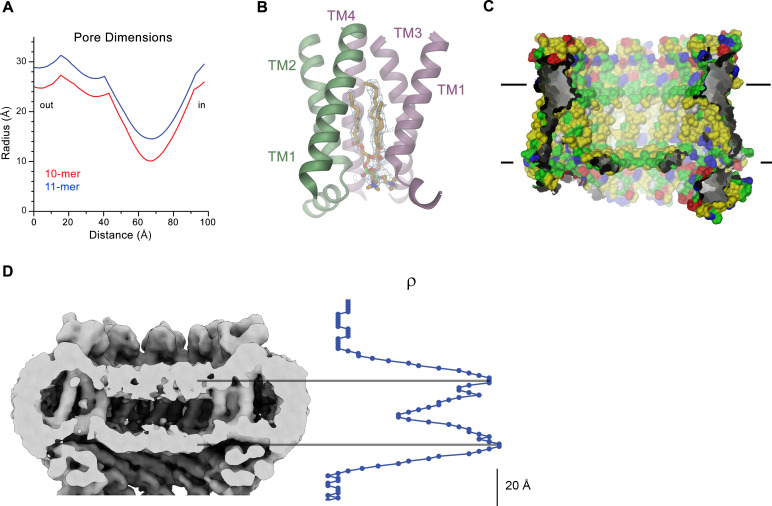
Figure 6. CALHM4 pore properties and lipid interactions.
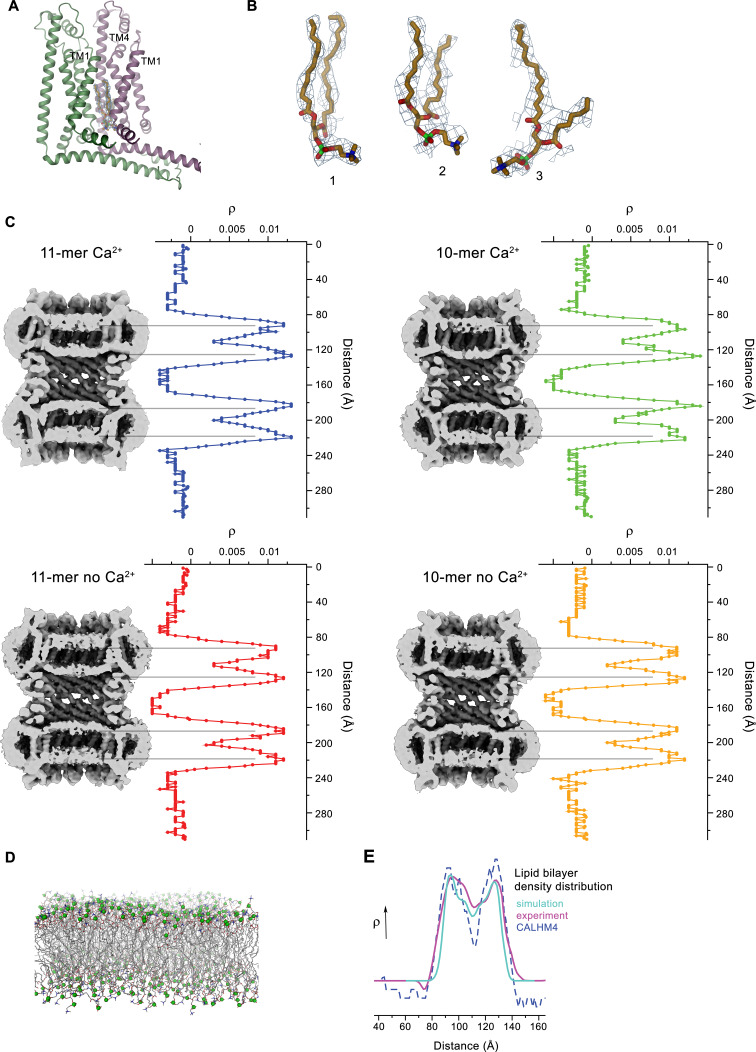
(A), Pore radius of the CALHM4 decamer (red) and undecamer (blue) as calculated in HOLE (Smart et al., 1996). (B) Two phosphatidylcholine molecules modeled into residual cryo-EM density (blue mesh) in a cavity at the interface between neighboring α-helices TM1. Secondary structure elements are indicated. (C) Chemical properties of residues lining the pore of the CALHM4 channel. Shown is a slice through the pore viewed from within the membrane. The protein is displayed as molecular surface. Hydrophobic residues are colored in yellow, polar residues in green, acidic residues in red and basic residues in blue. (D) Slice through the pore region of the CALHM4 undecamer viewed from within the membrane. Shown is non-averaged density in a single copy of the undecameric CALHM4 channel pair at low contour to highlight the location of increased density within the pore corresponding to a bilayer of either phospholipids or detergents. A plot of the density along the pore axis showing two maxima that are separated by the expected distance between the headgroup regions of a lipid bilayer is shown right. B, D, Displayed cryo-EM density refers to data from the undecameric channel in presence of Ca2+.


