. 2020 May 6;9:e55853. doi: 10.7554/eLife.55853

Figure 6. CALHM4 pore properties and lipid interactions.

(A), Pore radius of the CALHM4 decamer (red) and undecamer (blue) as calculated in HOLE (Smart et al., 1996). (B) Two phosphatidylcholine molecules modeled into residual cryo-EM density (blue mesh) in a cavity at the interface between neighboring α-helices TM1. Secondary structure elements are indicated. (C) Chemical properties of residues lining the pore of the CALHM4 channel. Shown is a slice through the pore viewed from within the membrane. The protein is displayed as molecular surface. Hydrophobic residues are colored in yellow, polar residues in green, acidic residues in red and basic residues in blue. (D) Slice through the pore region of the CALHM4 undecamer viewed from within the membrane. Shown is non-averaged density in a single copy of the undecameric CALHM4 channel pair at low contour to highlight the location of increased density within the pore corresponding to a bilayer of either phospholipids or detergents. A plot of the density along the pore axis showing two maxima that are separated by the expected distance between the headgroup regions of a lipid bilayer is shown right. B, D, Displayed cryo-EM density refers to data from the undecameric channel in presence of Ca2+.

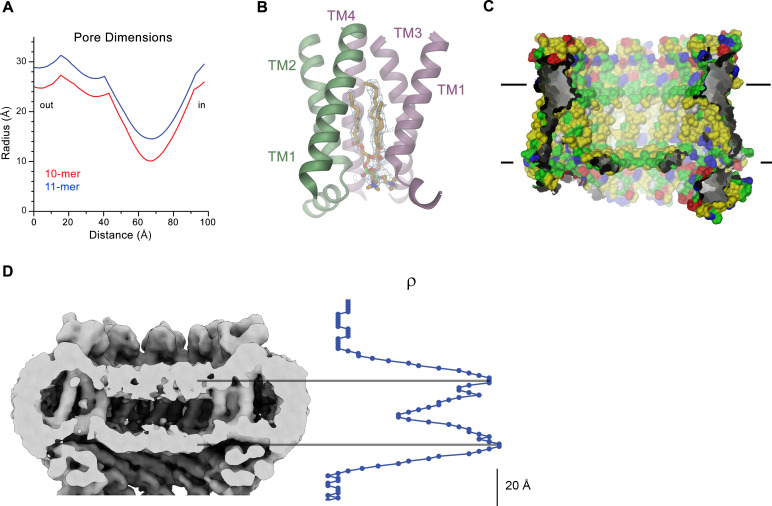
Figure 6.

Figure 6—figure supplement 1. Lipid interactions in the pore of CALHM4.

Figure 6—figure supplement 1.

(A) Interface between α-helices TM1 of two neighboring subunits with two bound lipid molecules. View is similar as in Figure 6A. (B) Lipids modeled into residual electron density at the interface displayed in A. Lipids 2 and 3 could occupy the cavity at the same time. 1 shows alternative interpretation of the density with a single lipid. A, B, Displayed cryo-EM density refers to data from the undecameric channel in presence of Ca2+. (C) Slices through the pore regions of interacting CALHM4 channel pairs as observed in different datasets. Proteins are viewed from within the membrane. Shown is non-averaged density at low contour (left). The distribution (right) shows two equivalent regions of increased density corresponding to bilayers of either phospholipids or detergents residing in each channel. The pore-density displays very similar features in CALHM4 decamers and undecamers irrespective of the presence or absence of Ca2+. (D) Model membrane obtained from MD simulations shown as stick models with the phosphate atoms highlighted as green spheres. (E) Comparison of the observed pore density distribution (dashed blue line, CALHM4) to equivalent distributions obtained from membrane simulations (cyan, simulation) and cryo-EM data of liposomes (magenta, experiment). All distributions display equivalent features.
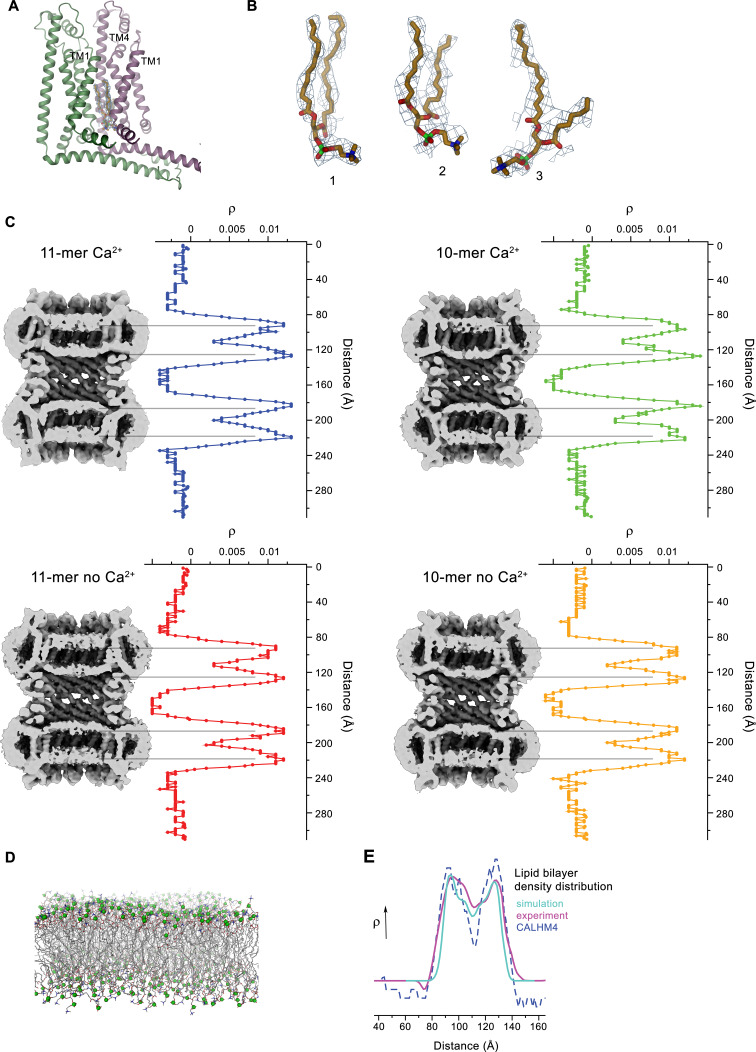
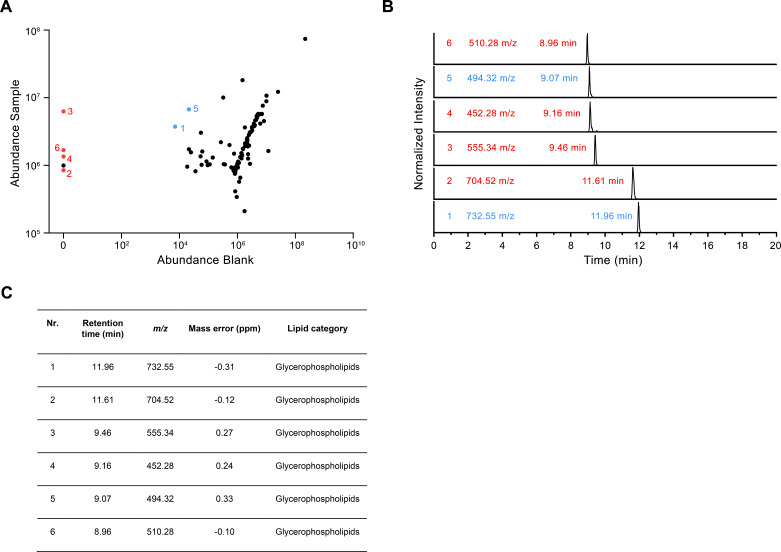
Figure 6—figure supplement 2. LC-MS analysis of co-purified lipids.

Figure 6—figure supplement 2.

(A) Scatter plot depicting the relative amounts of the 100 most abundant hydrophobic compounds detected in the LC-MS analysis of the CALHM4 sample compared to the blank. Red dots represent compounds that are detected in the CALHM4 sample only and blue dots represent compounds that are highly enriched in the CALHM4 sample compared to the blank (fold change >100). (B) TIC chromatograms of compounds indicated in A, with assigned mass to charge ratio (m/z) and retention time. (C) Table summarizing the properties of compounds isolated from the CALHM4 sample. The chemical identity was identified in a search against the LipidMaps (LM) library with matching tolerances of 1 ppm in mass accuracy and >90% in isotope similarity.