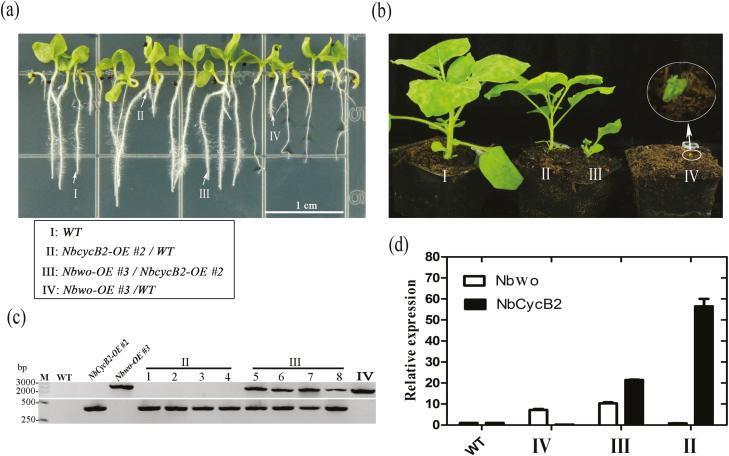
Fig. 7.
Hybridization between Nbwo-overexpressing (-OE) and NbCycB2-OE plants of N. benthamiana. (a, b) Phenotypes of NbCycB2-OE #2 and Nbwo-OE #3 hybridization F1 plants at (a) 2-weeks-old and (b) at maturity. I, wild-type (WT); II, NbCycB2-OE/WT hybrid T1; III, NbCycB2-OE #2 and Nbwo-OE #3 hybridization F1; IV, Nbwo-OE #3/WT hybrid T1. (c) F1 plants were examined using PCR. The reverse primer for the overexpression vector served as the 3´-terminal detection primer, and the forward primer for the detected genes served as the 5´-terminal primer. The WT served as a negative control, and Nbwo-OE #3 and NbCycB2-OE #2 served as positive controls. No DNA bands were detected in the WT. A ~330-bp DNA band was detected in the NbCycB2-OE #2 lines and a ~2199-bp band was detected in the Nbwo-OE #3 lines. In contrast, two bands were detected in NbCycB2-OE #2 and Nbwo-OE #3 hybridization F1 plants. (d) Relative expression levels of Nbwo and NbCycB2 in F1 plants as determined by qRT-PCR. Expression is relative to that of the WT, the value of which was set as 1. Data are means (±SD), n=3. (This figure is available in colour at JXB online.)

