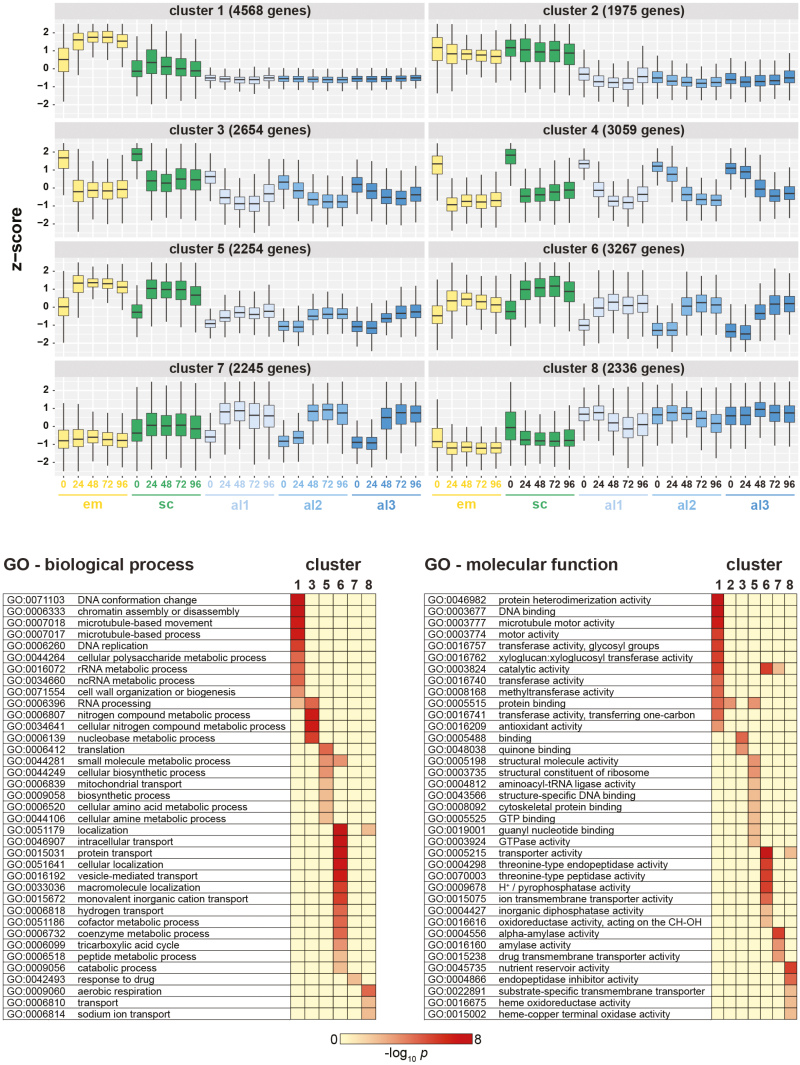
Fig. 2.
Co-expression of barley genes across tissues and time points. (A) Gene clustering using a self-organizing maps algorithm with 10 000 training iterations identified eight clusters of differentially expressed genes with similar expression patterns in the analysed tissue types and time points. The number of clusters was optimized for limited redundancy in co-expression patterns across clusters. Expression values in TPM were converted into z-scores before clustering. Numbers of genes in each cluster are as indicated. (B) For genes in each cluster, a GO term enrichment analysis (P<0.05 after Bonferroni correction) was performed for the ‘biological process’ and ‘molecular function’ ontologies. Scale indicates the –log10P-value for GO term enrichment.

