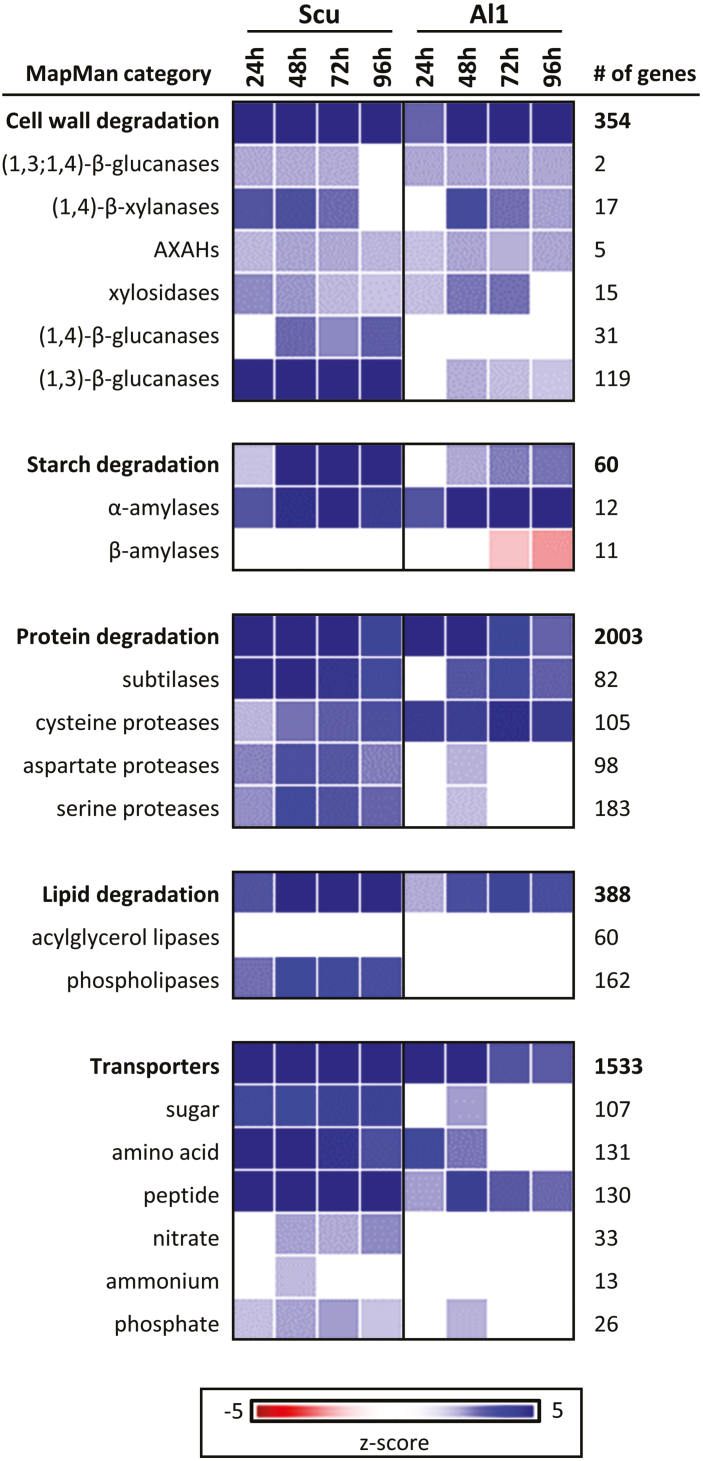
Fig. 3.
Gene expression in the aleurone al1 and scutellum. Using the PageMan tool, the difference in median fold change (relative to the 0 h time point) in gene expression for a particular category of genes was determined by applying a Wilcoxon rank sum test and converting resulting P-values to z-scores (Usadel et al., 2006). For the aleurone (Al1) and scutellum (Scut) tissues, the major categories of encoded enzymes are shown. The top line in each panel gives the overall pattern for genes in that category, which is broken down into selected gene categories below. The number of genes represented in each category is given on the right.

