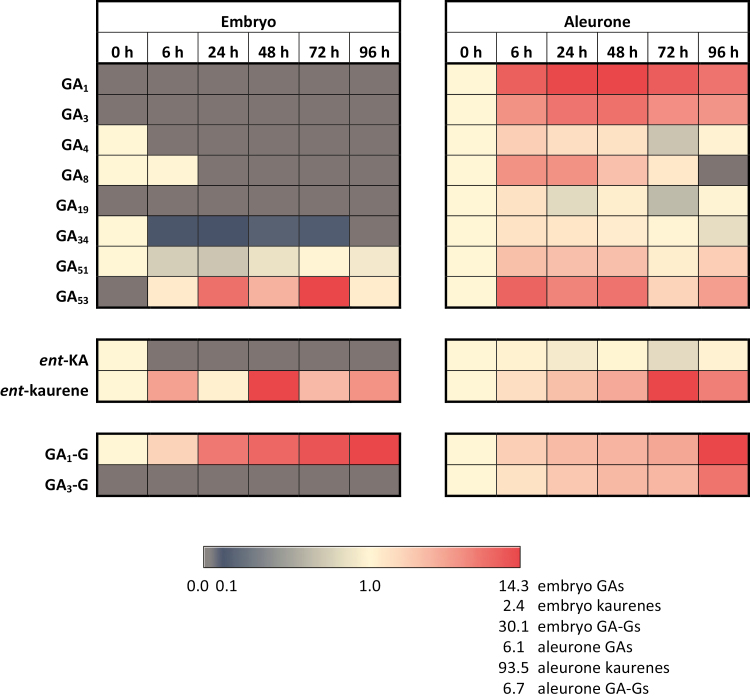
Fig. 6.
Heat maps showing changes in levels of GAs, GA-glycosides, and ent-kaurene/ent-kaurenoic acid in embryo and aleurone from 0 h to 96 h after the initiation of germination. Units are fold changes compared with the 0 h time point. Values <1 indicate reduced levels and those >1 indicate increased levels. A grey cell indicates a zero value.

