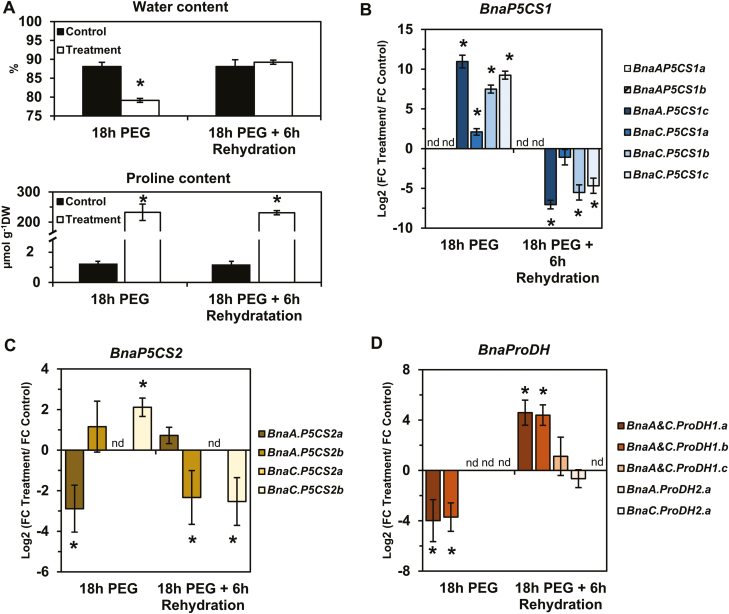
Fig. 6.
Transcript level variations of the BnaP5CS and BnaProDH genes during osmotic stress and rehydration in B. napus. For the ‘treatment’ condition, leaf discs from L7 leaves were subjected to a hyperosmotic stress (–1.88 MPa) for 18 h and then transferred to a hypo-osmotic medium for 6 h of rehydration under continuous light. For the ‘control’ condition, leaf discs from L7 leaves were incubated in the hypo-osmotic medium (same medium without PEG) for 18 h and then transferred to a new fresh medium for 6 h, under continuous light. (A) Water and proline content and log2 values for the ratio of fold change (FC) expression levels in the treated leaf discs over the control leaf discs for BnaP5CS1 (B), BnaP5CS2 (C), and BnaProDH genes (D). Values are the mean ±SD of three independent biological replicates. Asterisks indicate that mean values are significantly different between the two conditions (treatment versus control) (P-value <0.05). (This figure is available in colour at JXB online.)

