Fig. 9.
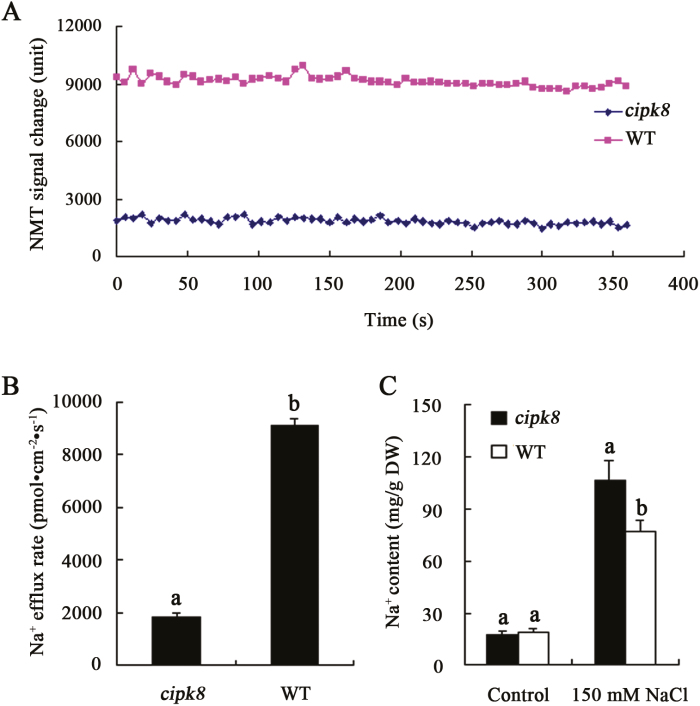
Na+ flux in leaves and total Na+ content in wild-type and cipk8 mutant plants. (A) The change in NMT signal is expressed as arbitrary units. Seedlings were grown in MS plates containing 100 mM NaCl for 24 hours, after which Na+ flux in leaves was measured using the NMT technique as described in ‘Materials and methods’. (B) Na+ efflux activity is measured as the concentration of exported Na+ per second per square centimeter (pmol cm−2 s−1), and data represent the mean ±SE of six replicates. (C) Changes in the total Na+ content in cipk8 and wild-type leaves under conditions of salt stress; data represent the mean ±SE of three replicates. Letters above the columns indicate significant differences with P<0.05. (This figure is available in color at JXB online.)

