Fig. 4.
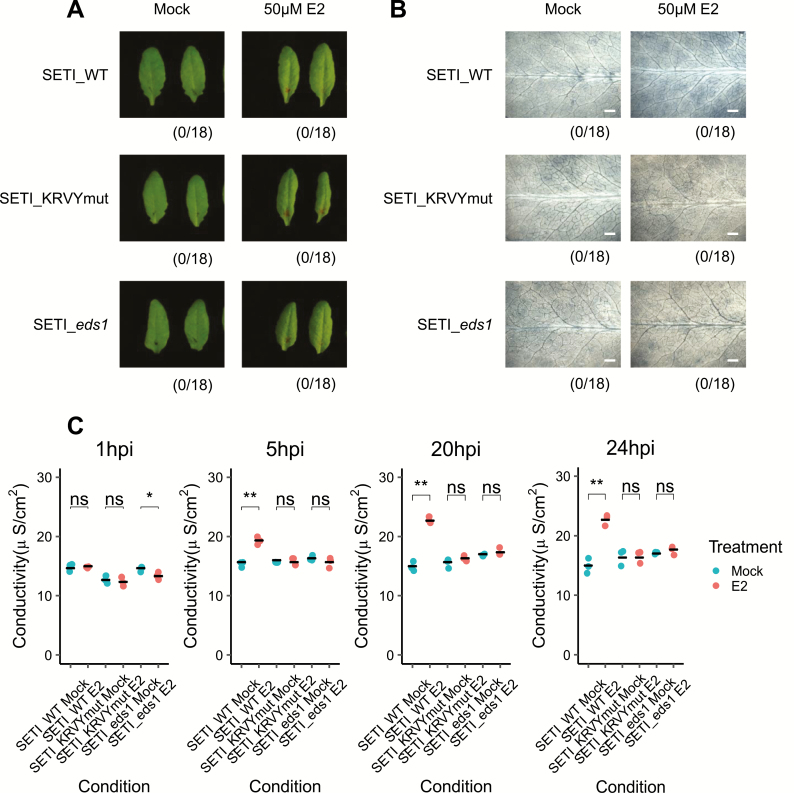
Induced expression of AvrRps4 in Arabidopsis causes microscopic but not macroscopic cell death. (A) HR phenotype assay in Arabidopsis. Five-week-old SETI_WT, SETI_KRVYmut, and SETI_eds1 leaves were mock infiltrated (1% DMSO) or infiltrated with 50 μM E2. Images were taken at 1 dpi. Numbers indicate the number of leaves displaying cell death from the total number of infiltrated leaves (18 for each genotype and treatment). (B) Trypan blue staining. Five-week-old SETI_WT, SETI_KRVYmut, and SETI_eds1 were mock infiltrated (1% DMSO) or infiltrated with 50 μM E2. Leaves were stained with trypan blue solution at 1 dpi. After destaining, leaves were imaged using a stereoscopic microscope. Scale bar=0.5 mm. (C) Electrolyte leakage assay. Five-week old SETI_WT, SETI_KRVYmut, and SETI_eds1 leaves were mock infiltrated (1% DMSO) or infiltrated with 50 μM E2. Fifteen leaf discs were collected for each data point. Conductivity was measured at 1, 5, 20, and 24 hours post-infiltration (hpi). Each data point represents one technical replicate, and three technical replicates are included per treatment and genotype for one biological replicate. The black line represents the mean of the technical replicates. This experiment was repeated three times independently with similar results (Supplementary Fig. S2). Significant differences relative to the mock treatment in each genotype were calculated with t-test, and the P-values are indicated as ns (non-significant), P>0.05; *P<0.05; **P<0.01; ***P<0.001. (This figure is available in colour at JXB online.)

