Fig. 1.
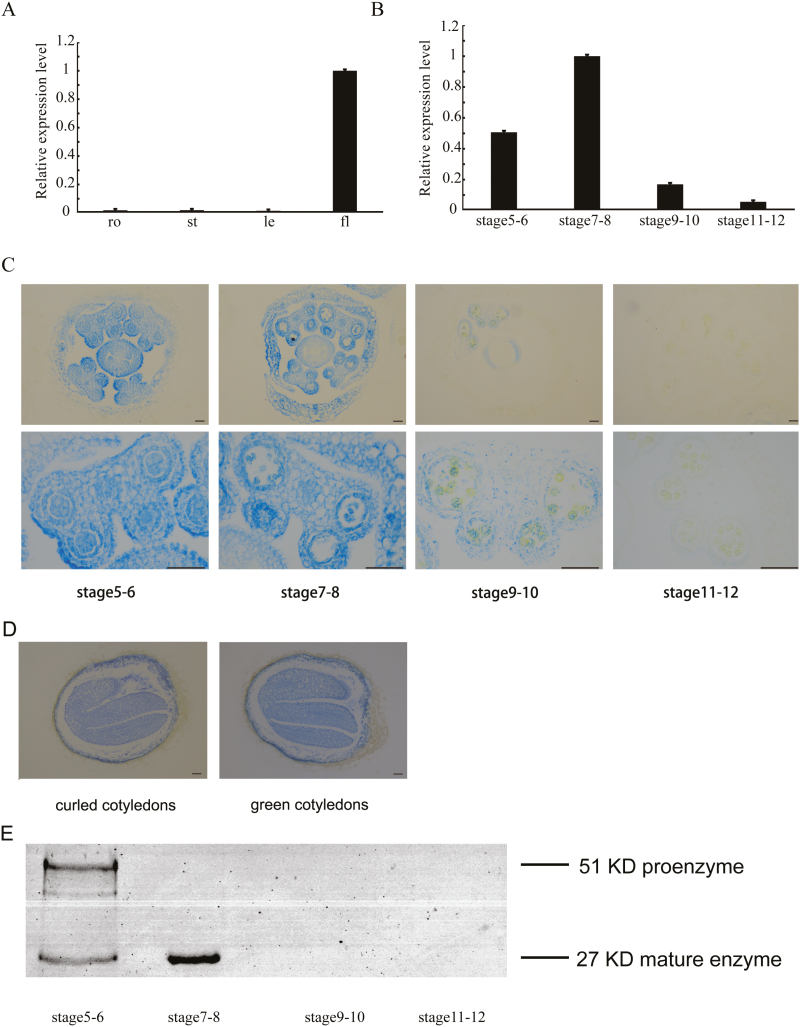
βVPE expression pattern. (A) βVPE spatial and temporal expression analyses performed by qRT–PCR. Fl, flower; le, leaf; ro, root; st, stem. (B) qRT–PCR of βVPE expression in wild-type bud tissues at different developmental stages. Bars represent SDs. The expression of βVPE in stages 7–8 was selected as 1. (C) Histochemical assay for GUS activity in anthers during stages 5–12. Scale bar=20 μm. (D) GUS activity in the developing seeds during the curled cotyledons stage to the green cotyledons stage. Scale bar=20 μm. (E) Immunoblot analysis of total anther protein extracts from stages 5–12 with anti-mature βVPE antibody.

