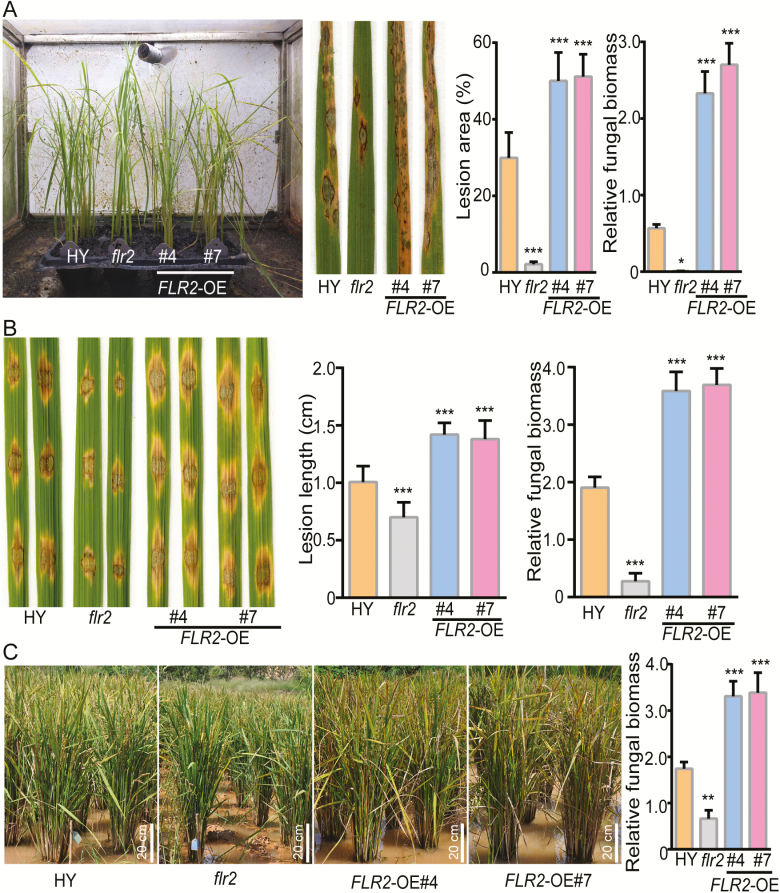
Fig. 4.
FLR2 functions in rice blast resistance. (A) Disease symptoms of HY, flr2, and FLR2-OE plants at 7 dpi; the plants were inoculated (by spraying) with the compatible M. oryzae isolate 70-15. The percentage of lesion areas (disease index) was scored via image analysis with ImageJ software (n=5 leaves). Fungal growth was measured by the expression level of the Magnaporthe oryzae MoPot2 gene in the inoculated leaves via qRT-PCR, and the levels were normalized to the expression level of the OsUbi gene (n=3). (B) Phenotypes of HY, flr2, and FLR2-OE plants at 7 dpi after they were inoculated (by wounding) with the compatible M. oryzae isolate 70-15 (n=15 lesions). (C) Disease resistance of HY, flr2, and FLR2-OE plants in the blast nursery (n=3). Scale bar=20 cm. (A–C) The error bars correspond to 1 SD as determined by the duplicate analyses. The data are shown as the mean ±SD. The asterisks indicate significant differences from the control, as determined by one-way ANOVA followed by Tukey’s test (*P<0.05, **P<0.01, ***P<0.001). Three independent biological replicates of (A–C) were tested, each yielding similar results.

