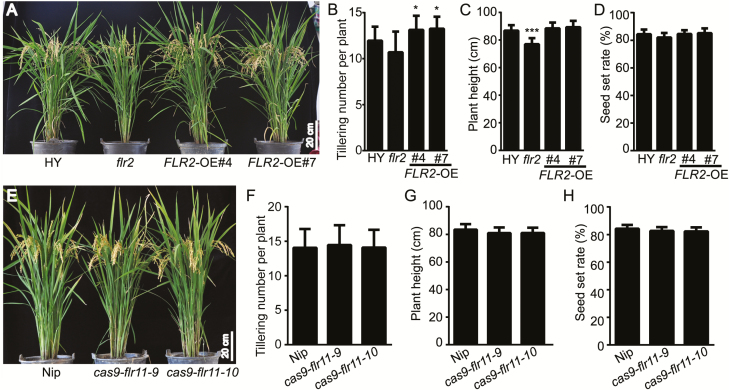
Fig. 7.
FLR2/11 gene function in rice growth and development. (A) Morphology of mature flr2, FLR2-OE lines, and wild-type HY plants in normal field conditions. Scale bar=20 cm. (B–D) Tiller numbers, plant heights, and seed setting rates of flr2, FLR2-OE lines, and wild-type HY plants (n=25). (E) Morphology of mature flr11 mutants and wild-type Nip plants. Scale bar=20 cm. (F–H) Tiller number, plant height, and seed setting rate of flr11 mutants and wild-type Nip plants in normal field conditions (n=25). The error bars correspond to 1 SD as determined by the duplicate analyses. The data are shown as the mean ±SD. The asterisks indicate significant differences from the control, as determined by one-way ANOVA followed by Tukey’s test (*P<0.05, **P<0.01, ***P<0.001). Three independent biological replicates of (A–G) were tested, each yielding similar results. (This figure is available in color at JXB online.)

