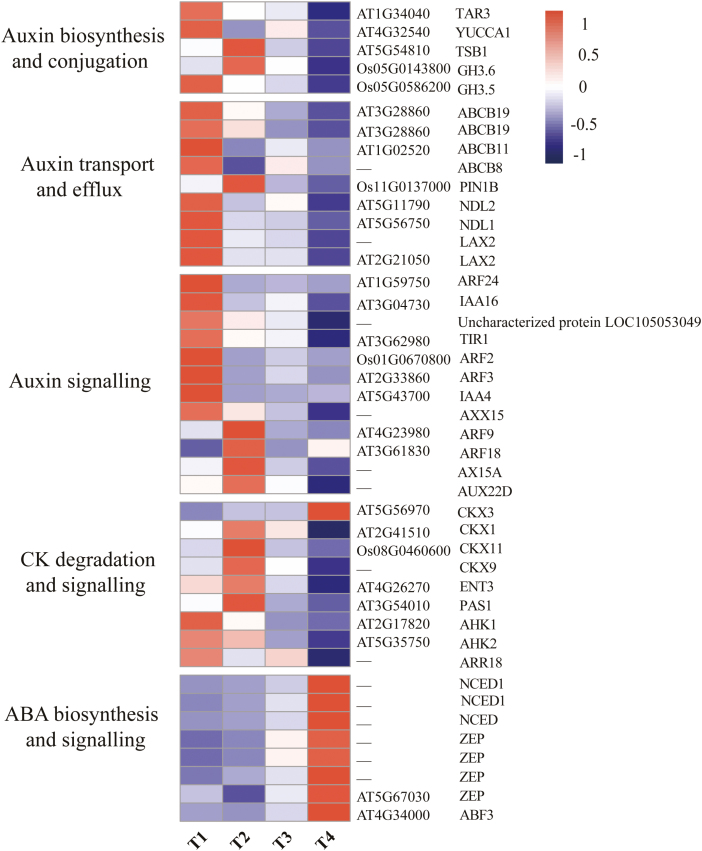
Fig. 5.
Heat maps of gene sets associated with hormone (auxin, CK, and ABA) biosynthsis and catabolism, transport, and signaling. The expression levels are standardized per gene into Z-scores and colored in red and blue for high and low expression, respectively. Gene names (shown on the right) are described in detail in Supplementary Dataset S1.

