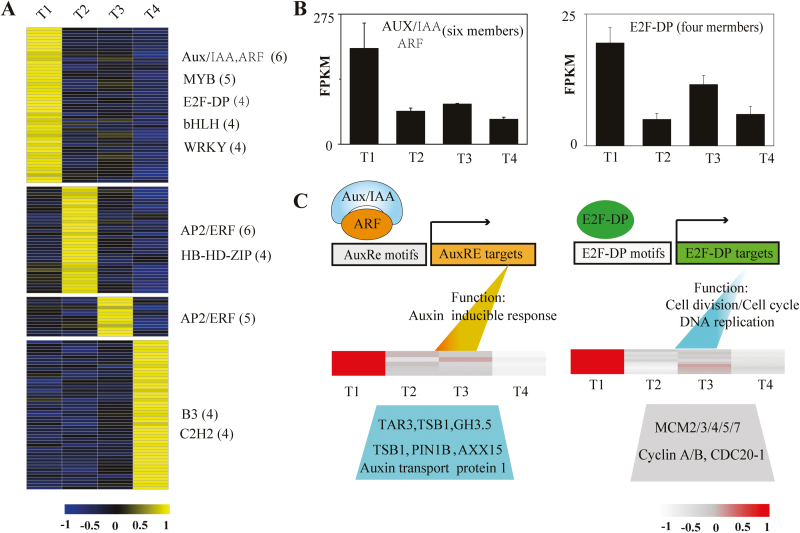
Fig. 7.
Expression profiles of transcription factors (TFs) and hypothetical regulatory modules. (A) Heat map of scaled FPKM values of 149 stage-specific TFs (with SS score >0.3) identified during bulbil growth. The TF families listed on the right show predominantly expression in corresponding stage-specific clusters. The numbers in parentheses represent the number of members from TF families in this cluster. (B) Cumulative expression profiles of AUX/IAA (six members) and E2F-DP (four members) TFs in the T1-specific cluster. (C) Hypothetical models of AUX/IAA- and E2F-DP- mediated gene regulation in the T1-specific cluster. The heat map shows the expression of genes involved in GO functional categories by AUX/IAA and E2F-DP induction, suggesting that the two TFs and their targets are co-over-represented in the T1-specific cluster.

