

Abstract
The proprietary neuropsychological tests (Form C1) of the National Alzheimer’s Coordinating Center (NACC) Uniform Data Set were replaced with nonproprietary versions (Form C2) chosen to closely model their proprietary counterparts. Correlations between analogous test pairs as measured in previous work were good (0.68-0.78), but it is unclear whether the paired tests represent the same set of common factors of cognition or if important factors specific to C1 or C2 only exist. The authors performed multiple factor analysis to analyze correlated C1 and C2 data. They included participants who completed both neuropsychological batteries within 1 year with no change in cognitive status. They found that the C1 and C2 neuropsychological test pairs are strongly related and are represented by the same principal factors. These findings support the use of the C2 test results in conjunction with C1 in longitudinal analyses of NACC data.
Key Words: neuropsychological test, multiple factor analysis (MFA), principal component analysis (PCA), cognition, UDS
Neuropsychological tests are an important tool in the study of Alzheimer disease and related dementias. When evaluated over time, test scores can help determine whether an individual is experiencing cognitive decline, temporary impairment, or stable cognition. The National Alzheimer’s Coordinating Center (NACC) Uniform Data Set (UDS) collected by the Alzheimer’s Disease Centers (ADCs) in the United States includes a standardized neuropsychological battery administered approximately annually to each participant. The battery includes tests of executive function, episodic memory, attention/working memory, and language/semantic memory.
In 2015, at the recommendation of the Neuropsychological Work Group of the National Institute on Aging (NIA) Clinical Task Force, the proprietary neuropsychological tests (Form C1) of UDS were replaced with nonproprietary versions (Form C2).1 Test equivalents were chosen to model their proprietary counterparts as closely as possible with the goal of maintaining longitudinal data integrity. Four new tests were chosen for Form C2; the Montreal Cognitive Assessment (MoCA) replaced the Mini Mental State Examination (MMSE), Craft Story 21 Recall (Immediate and Delayed) replaced Wechsler Memory Scale-Revised (WMS-R) Logical Memory (Immediate and Delayed), Number Span (Forward and Backward) replaced Digit Span (Forward and Backward), and the Multilingual Naming Test (MINT) replaced the Boston Naming Test (BNT).
In anticipation of the transition to the nonproprietary tests, a crosswalk study was conducted to determine correlations between analogous test pairs and create a score crosswalk between test versions.2 Over 900 participants were administered both versions of the neuropsychological tests (C1 and C2) at the same visit. Correlations between analogous test pairs were good (0.68 to 0.78), but it is unclear whether the paired tests represent the same set of common factors of cognition or if important factors specific to C1 or C2 only exist. In this analysis, we performed a multiple factor analysis (MFA) to analyze correlated C1 and C2 data to determine whether the test batteries are represented by common principal components.
METHODS
The NACC UDS is a standardized evaluation of participants in the NIA ADC program. Written informed consent is obtained at the individual ADCs and approved by individual Institutional Review Boards (IRBs). In this study, participants were limited to those diagnosed with a cognitive status of normal cognition, mild cognitive impairment (MCI), or dementia. In addition to 900 participants from the Crosswalk Study, we included 1465 participants from the UDS who completed both C1 and C2 neuropsychological batteries within 1 year with no change in cognitive status between batteries.
To compare the results of the 2 neuropsychological batteries taken by the same participants, we used MFA, an extension of principal component analysis (PCA).3 MFA is a method that can be used when there are 2 or more structured sets of variables describing individuals. In addition to analyzing the data globally, MFA allows us to compare information across variable groups (here, neuropsychological test batteries).
MFA first performs a PCA on each variable set, which is then normalized by dividing its elements by the square root of the first eigenvalue from the PCA. This ensures that none of the variable sets will dominate representation in the overall MFA. Next, the normalized data tables are aggregated into 1 overall data table that is analyzed using PCA. The result is a set of observation factor scores and variable loadings that allow us to compare the variable sets.3
The 4 test pairs studied represent several cognitive domains.1 The MMSE and MoCA measure overall cognitive impairment, including executive function, language/semantic memory, and attention/working memory domains. The WMS-R Logical Memory and Craft Story 21 Recall tests are a measure of episodic memory. Digit Span and Number Span tests measure attention/working memory. The BNT and MINT are a measure of the language/semantic memory domain.
Our analysis included a total of 8 measures from both neuropsychological batteries (Fig. 1), each defined as a variable set. Tests that were either unchanged from C1 to C2 or did have not a direct counterpart were excluded from the analysis. Both paraphrase and verbatim scores were available for the Craft test, but only the paraphrase score was used as it had a direct counterpart in the Logical Memory test. As the MMSE is not adjusted for the level of education, we used the raw unadjusted total score from the MoCA in our analysis.
FIGURE 1.
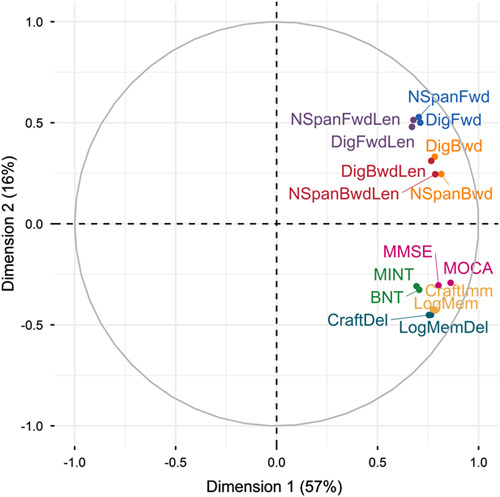
Multiple factor analysis correlation circle (test pairs denoted by color). BNT indicates Boston Naming Test; CraftDel, Craft Story 21 Recall (Delayed); CraftImm, Craft Story 21 Recall (Immediate); DigBwd, Digit Span (Backward)—trials correct; DigBwdLen, Digit Span (Backward)—longest run; DigFwd, Digit Span (Forward)—trials correct; DigFwdLen, Digit Span (Forward)—longest run; LogMem, WMS-R Logical Memory IA (Immediate); LogMemDel, WMS-R Logical Memory IB (Delayed); MINT, Multilingual Naming Test; MMSE, Mini Mental State Examination; MoCA, Montreal Cognitive Assessment; NSpanBwd, Number Span (Backward)—trials correct; NSpanBwdLen, Number Span (Backward)—longest run; NSpanFwdLen, Number Span (Forward)—longest run.
All scores were normalized before inclusion in the analysis by centering and dividing by the standard deviation. Cognitive status was included as a supplementary variable; supplementary variables are not considered in the development of the factors, but results of the MFA can be compared between levels of the variable. The MFA was run using the FactoMineR package4 in R v3.6.1.5
RESULTS
Of the 2365 participants who met inclusion criteria, 1491 were cognitively normal, 327 had MCI, and 547 had dementia. The participants were 58% female individuals, 83% white, and 3% Hispanic, and were on average 73.5 years old (SD: 9.5) with 16 years of education (SD: 2.9).
The first 2 factors from the MFA explained 73% of the variance of the data. Each test pair had very similar loadings on the first 2 factors, as shown on the correlation circle (Fig. 1). All test variables had strong loadings (0.67 to 0.86) on the first dimension, which seems to represent the level of cognition as higher scores for each test are indicative of better cognition. Test pairs were separated more clearly on the second dimension (loadings from −0.45 to 0.53), with positive loadings on the attention/working memory tests (number and digit span), and negative on the remaining tests. Note that the first factor explained fully 57% of the total variance, whereas the second factor only explained 16%.
Overall, the C1 and C2 group coordinates were almost identical for the first 2 dimensions (dimension 1: 0.950 for both C1 and C2; dimension 2: 0.269 for C1 and 0.252 for C2), meaning that each test battery contributes similarly to these dimensions and the first 2 dimensions of the MFA are common to both batteries. The RV coefficient between C1 and C2 batteries was 0.762, indicating relatively high common inertia between the groups.
Factor loadings on the first 2 dimensions partially delineated individuals’ cognitive status. Figure 2 shows individual factor loadings with ellipses covering 95% of participants with each cognitive status. Individuals with normal cognition generally had much higher loadings on the first dimension and slightly lower loadings on the second dimension compared with those with dementia. The MCI group loadings fell in between the normal cognition and dementia groups, with substantial overlap with both groups. The RV coefficient between cognitive status and the MFA was relatively low at 0.379. This is partly driven by the indistinct MCI group.
FIGURE 2.
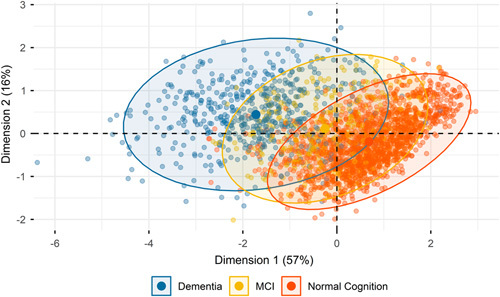
Individual factor map of the first 2 factors (ellipses covering 95% of individuals with each cognitive status). MCI indicates mild cognitive impairment.
DISCUSSION
The C1 and C2 neuropsychological test pairs were represented very similarly by the principal factors of the MFA. This was true not only for test pairs that were markedly similar to the Digit Span and Number Span tests but also for pairs with substantial differences like the MoCA and MMSE. The MFA revealed a common underlying structure between test batteries enabling the tests to be analyzed together in longitudinal analyses. Further, these results support the assumption that the neuropsychological batteries are a measure of cognitive status as higher loadings on the first dimension represented both higher scores on the tests and increased likelihood of having normal cognition.
Our results add to the prior results of the Crosswalk Study, which found good correlations between test pairs and high prediction accuracy.2 It is interesting to note that test measures with the highest variability in the Crosswalk Study (Logical Memory and Craft Story) had almost identical loadings on the first 2 dimensions in this analysis.
We note that NACC UDS participants are not a randomly drawn sample and therefore may not be representative of the general population. In particular, the NACC sample is known to be more highly educated and less racially diverse than the general population, and neuropsychological test norms can vary significantly by race6 and education.1 However, the main aim of this analysis was to evaluate commonalities of the C1 and C2 batteries for use with the NACC database, and the sample used was internally valid with the NACC UDS population.
In summary, the C1 and C2 neuropsychological test batteries are strongly related and are represented by the same principal factors. These findings support the use of the C2 test results in conjunction with C1 in longitudinal analyses of NACC data.
Footnotes
The NACC database is funded by NIA/NIH Grant U01 AG016976. NACC data are contributed by the NIA-funded ADCs: P30 AG019610 (PI Eric Reiman, MD), P30 AG013846 (PI Neil Kowall, MD), P30 AG062428-01 (PI James Leverenz, MD) P50 AG008702 (PI Scott Small, MD), P50 AG025688 (PI Allan Levey, MD, PhD), P50 AG047266 (PI Todd Golde, MD, PhD), P30 AG010133 (PI Andrew Saykin, PsyD), P50 AG005146 (PI Marilyn Albert, PhD), P30 AG062421-01 (PI Bradley Hyman, MD, PhD), P30 AG062422-01 (PI Ronald Petersen, MD, PhD), P50 AG005138 (PI Mary Sano, PhD), P30 AG008051 (PI Thomas Wisniewski, MD), P30 AG013854 (PI Robert Vassar, PhD), P30 AG008017 (PI Jeffrey Kaye, MD), P30 AG010161 (PI David Bennett, MD), P50 AG047366 (PI Victor Henderson, MD, MS), P30 AG010129 (PI Charles DeCarli, MD), P50 AG016573 (PI Frank LaFerla, PhD), P30 AG062429-01(PI James Brewer, MD, PhD), P50 AG023501 (PI Bruce Miller, MD), P30 AG035982 (PI Russell Swerdlow, MD), P30 AG028383 (PI Linda Van Eldik, PhD), P30 AG053760 (PI Henry Paulson, MD, PhD), P30 AG010124 (PI John Trojanowski, MD, PhD), P50 AG005133 (PI Oscar Lopez, MD), P50 AG005142 (PI Helena Chui, MD), P30 AG012300 (PI Roger Rosenberg, MD), P30 AG049638 (PI Suzanne Craft, PhD), P50 AG005136 (PI Thomas Grabowski, MD), P30 AG062715-01 (PI Sanjay Asthana, MD, FRCP), P50 AG005681 (PI John Morris, MD), P50 AG047270 (PI Stephen Strittmatter, MD, PhD).
The authors declare no conflicts of interest.
REFERENCES
- 1.Weintraub S, Besser L, Dodge HH, et al. Version 3 of the Alzheimer Disease Centers’ Neuropsychological Test Battery in the Uniform Data Set (UDS). Alzheimer Dis Assoc Disord. 2018;32:10–17. [DOI] [PMC free article] [PubMed] [Google Scholar]
- 2.Monsell SE, Dodge HH, Zhou XH, et al. Results from the NACC Uniform Data Set Neuropsychological Battery Crosswalk Study. Alzheimer Dis Assoc Disord. 2016;30:134–139. [DOI] [PMC free article] [PubMed] [Google Scholar]
- 3.Abdi H, Williams LJ, Valentin D. Multiple factor analysis: principal component analysis for multitable and multiblock data sets. Wiley Interdiscip Rev Comput Stat. 2013;5:149–179. [Google Scholar]
- 4.Le S, Josse J, Husson F. FactoMineR: an R Package for multivariate analysis. J Stat Softw. 2008;25:1–18. [Google Scholar]
- 5.R Core Team. R: A Language and Environment for Statistical Computing. 2019. Available at: https://www.r-project.org/. Accessed October 21, 2019.
- 6.Gasquoine PG. Race-norming of neuropsychological tests. Neuropsychol Rev. 2009;19:250–262. [DOI] [PubMed] [Google Scholar]