
Figure 3. Power Law Characteristics and Activity.
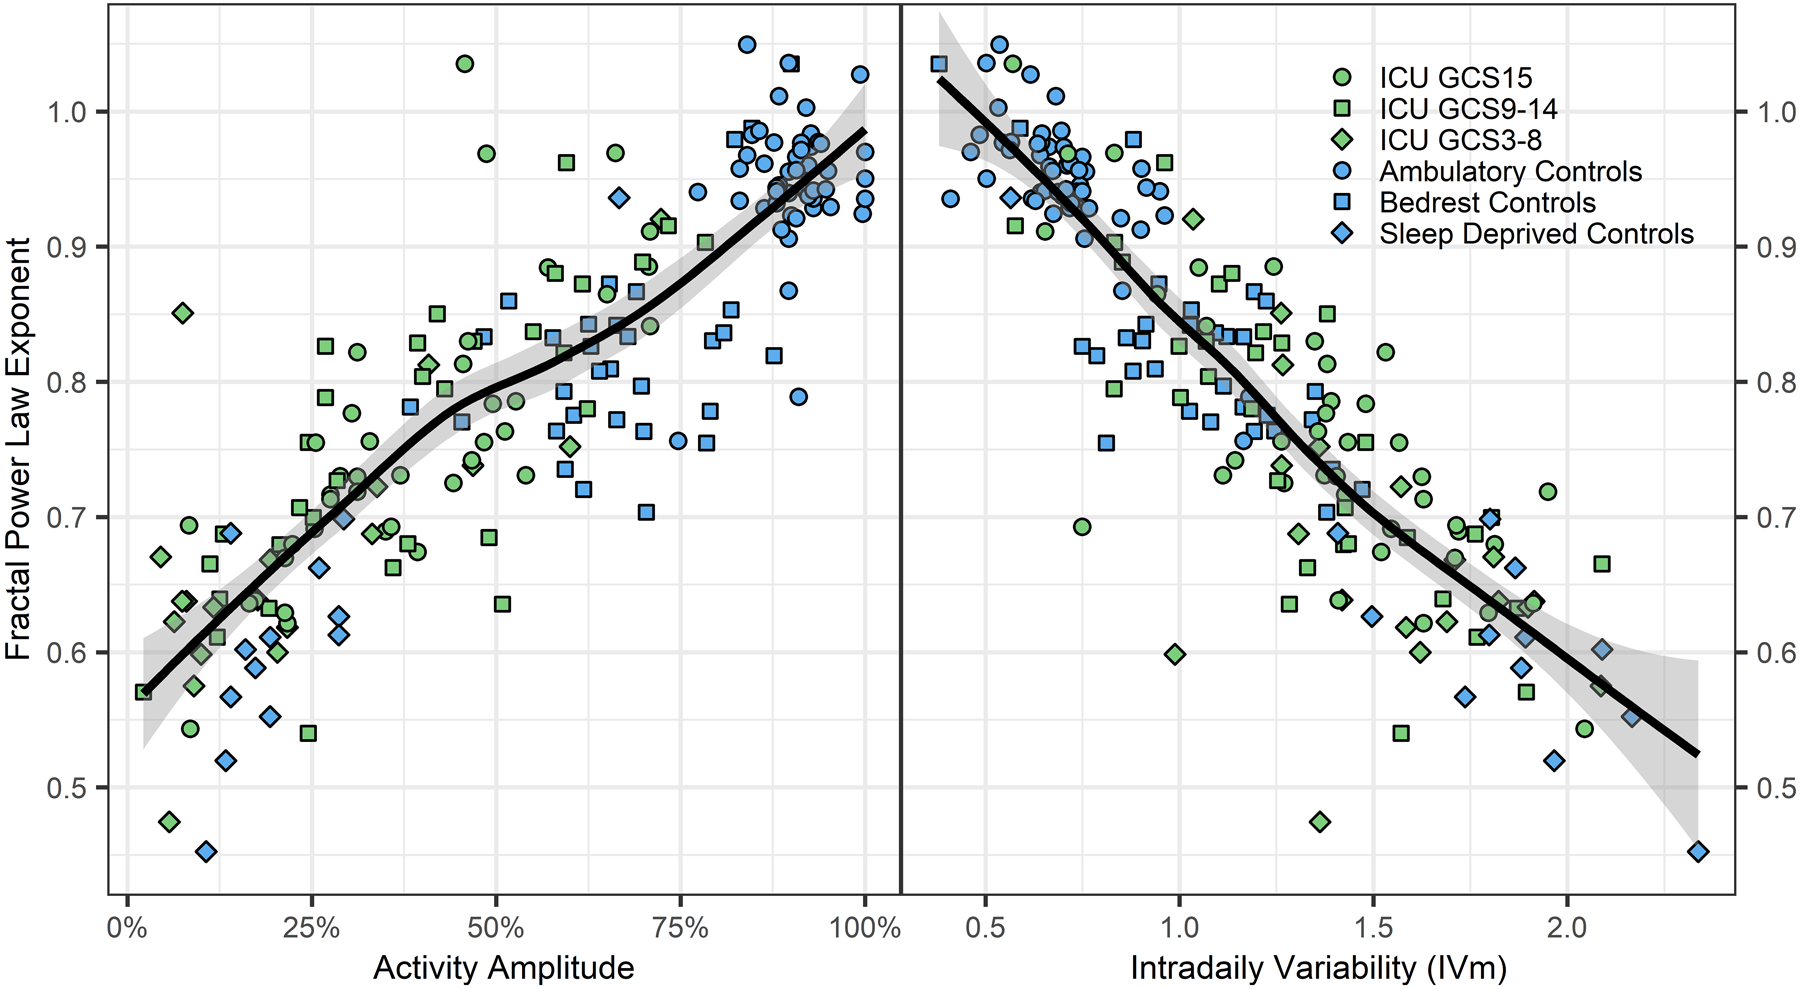
Figure 3 shows the power law exponent derived from detrended fluctuation analysis of actigraphy records plotted against activity amplitude (left panel) and sampling interval averaged intradaily variability (IVm; right panel). The power law exponent is a measure of ultradian rhythm integrity (near 1 is normal for healthy humans and 0.5 is randomness suggestive of poor biological control), whereas activity amplitude and IVm are measures of circadian rhythm integrity. The solid line and shaded area show the moving average trendline and its 95% confidence interval, respectively. These data show that deterioration in circadian rhythms, as measured by activity amplitude (rhythm strength) and intradaily variability (rhythm fragmentation) is strongly correlated with ultradian rhythm deterioration (lower fractal power law exponent).