
Figure 4.
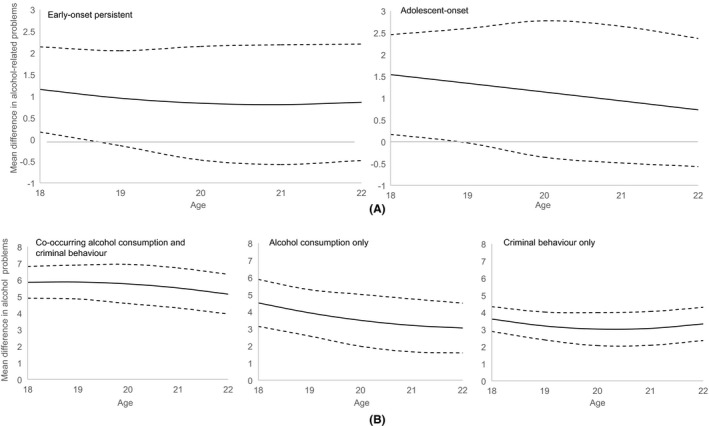
(A) Association between each conduct problem (CP) class and alcohol‐related problems from age 18 to 22 years; left figure shows ‘early‐onset persistent’ vs. ‘low’ CPs, right figure shows ‘adolescent‐onset’ vs. ‘low’ CPs; solid line shows mean difference in alcohol‐related problems across each class comparison, and dashed lines show 95% confidence intervals around the effect estimates. (B) Association between each class of age 15 alcohol and criminal behaviour and alcohol‐related problems from age 18 to 22 years; left figure shows ‘co‐occurring alcohol and criminal behaviour’ vs. ‘neither’, middle figure shows ‘alcohol consumption only’ vs. ‘neither’, right figure shows ‘criminal behaviour only vs. neither’; solid line shows mean difference in alcohol‐related problems across each class comparison and dashed lines show 95% confidence intervals around the effect estimates