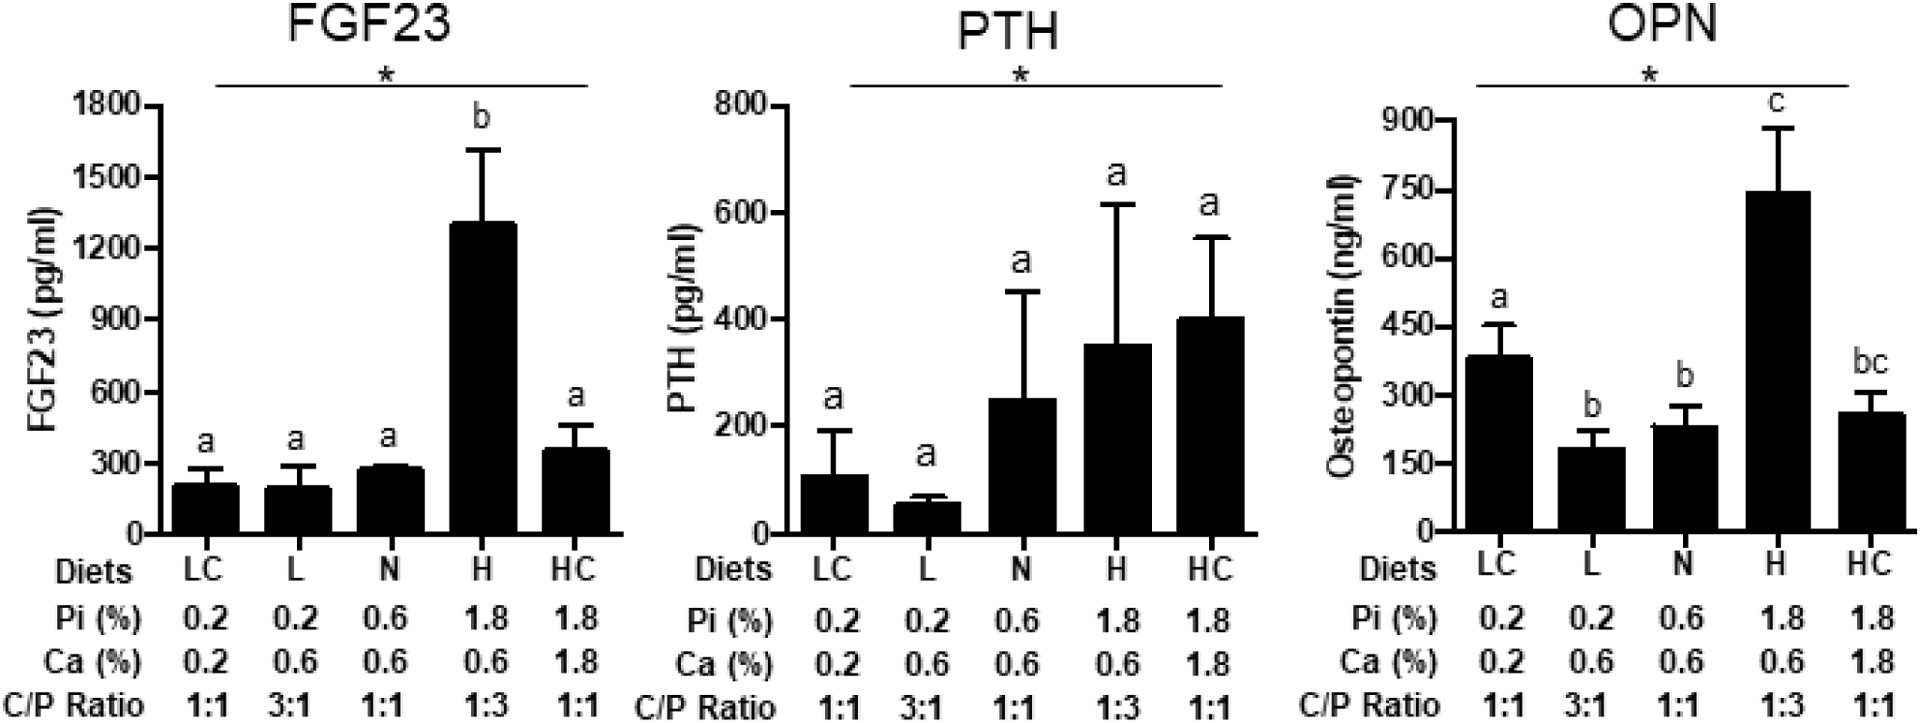
Fig. 4.

Levels of phosphorus responsive endocrine factors. Serum concentrations of fibroblast growth factor 23 (FGF23), Parathyroid Hormone (PTH) and Osteopontin (OPN) from mice described in Fig.3. LC (LCPD), L (LPD), N (NPD), H (HPD), HC (HCPD). *P≤0.05 for overall effect of diets by ANOVA. Different letters denote a significant difference at P≤0.05 by post-hoc multiple comparisons. N=5.
