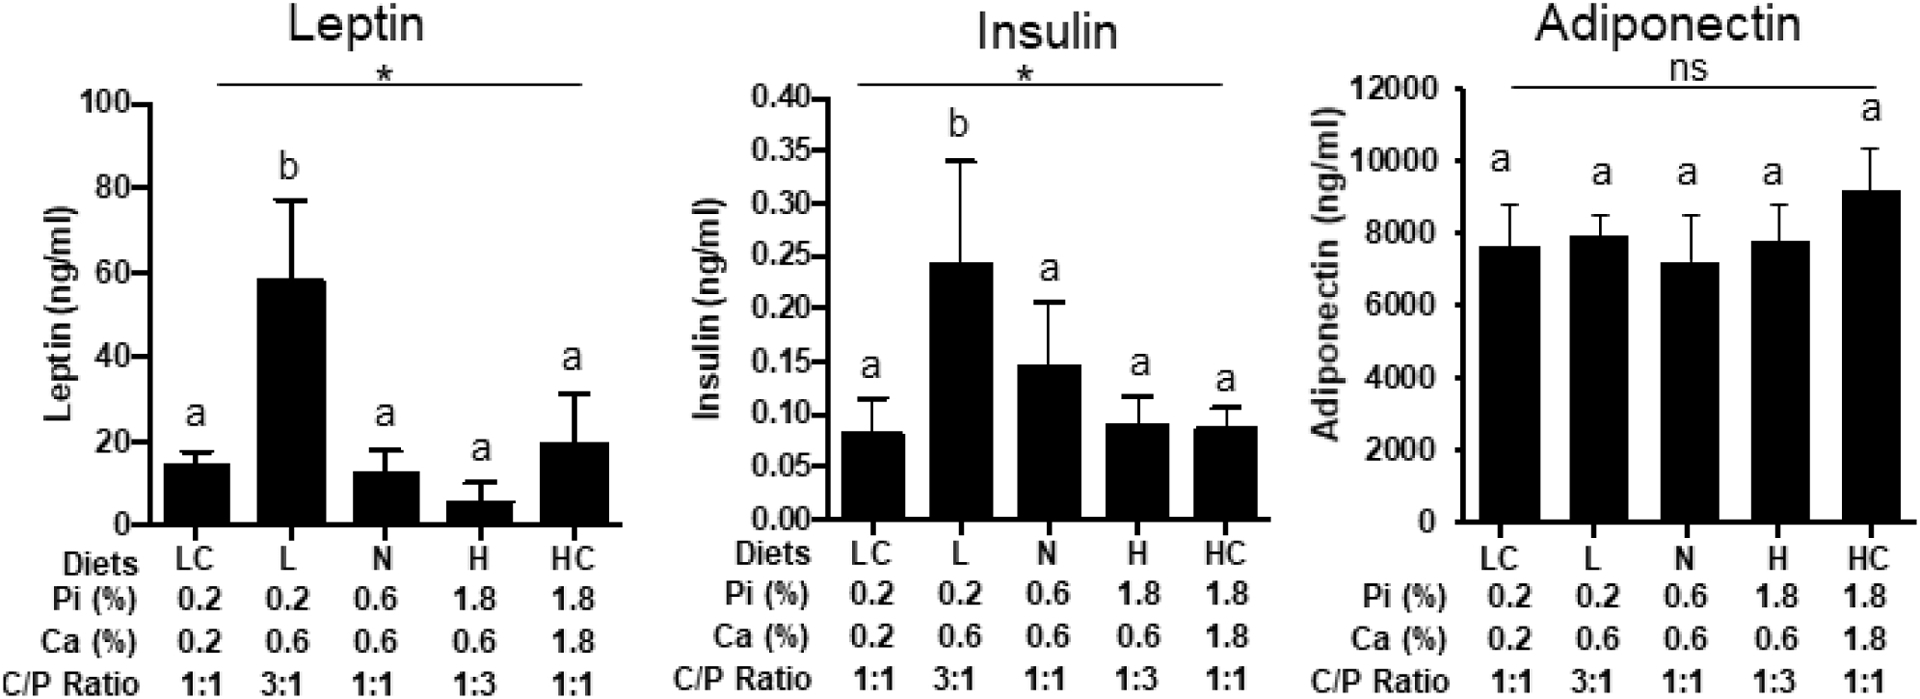
Fig. 6.

Changes in energy metabolism markers. Serum concentrations of Leptin, Insulin, and Adiponectin from mice described in Fig.3. LC (LCPD), L (LPD), N (NPD), H (HPD), HC (HCPD). *P<0.05 for overall effect of diets by ANOVA. *P≤0.05 for overall effect of diets by ANOVA. Different letters denote a significant difference at P≤0.05 by post-hoc multiple comparisons. N=5. (ns: not significant).
