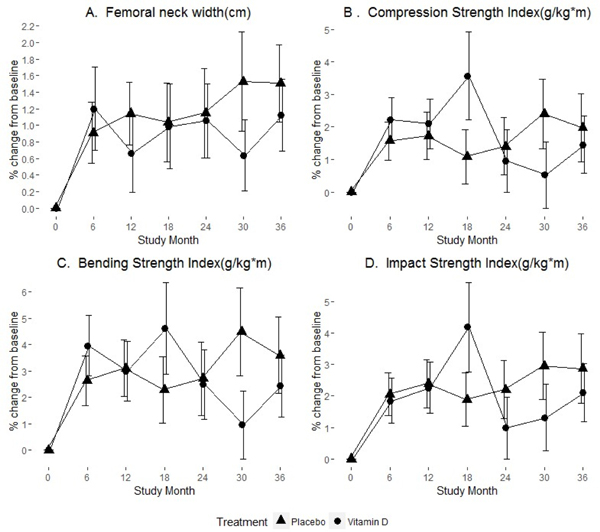
Figure 1.

Percent change in femoral neck width and the strength indices over time stratified by treatment group. Group means (circle/triangle) ±1 standard error at each study visit for: (A) Femoral neck width, (B) Compression Strength Index, (C) Bending Strength Index, and (D) Impact Strength Index
