Figure 5.

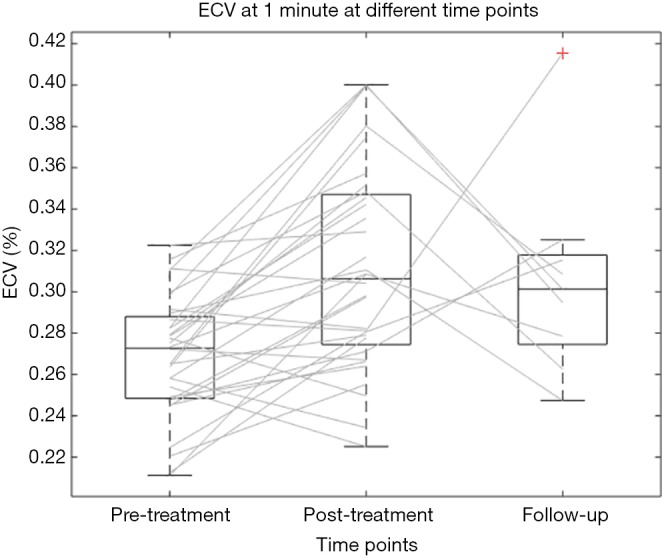
Boxplot depicting values of myocardial extracellular volume (ECV) at 1 min at different time points, namely before treatment, after treatment and at follow-up. Individual subjects ECV variations are represented by connecting lines.

Boxplot depicting values of myocardial extracellular volume (ECV) at 1 min at different time points, namely before treatment, after treatment and at follow-up. Individual subjects ECV variations are represented by connecting lines.