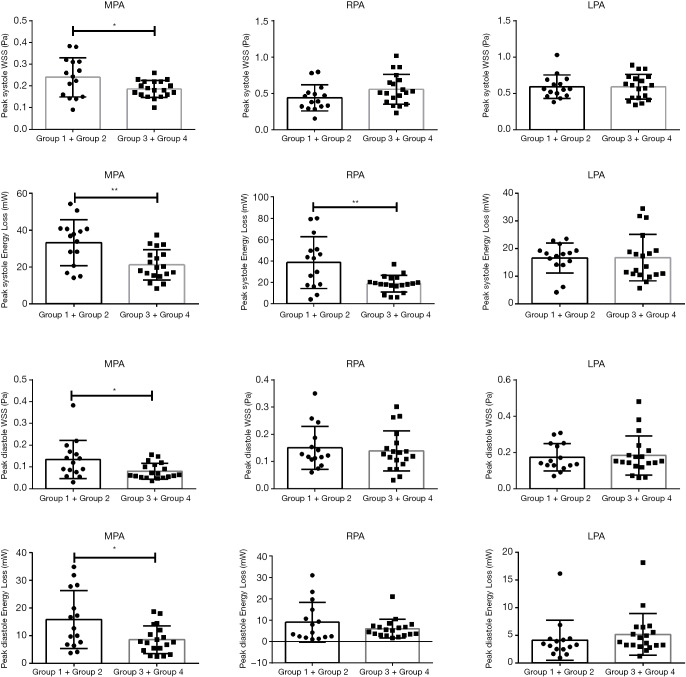
Figure 5.
Comparison of cardiac function, WSS, and EL in group 1+2 and group 3+4 during the systole and diastole in the MPA, RPA, and LPA of rTOF patients and volunteers. *, indicates statistical significance (P<0.05); **, indicates statistical significance (P<0.01). MPA, main pulmonary artery; RPA, right pulmonary artery; LPA, left pulmonary artery; WSS, wall shear stress; EL, energy loss; rTOF, repaired tetralogy of Fallot.

