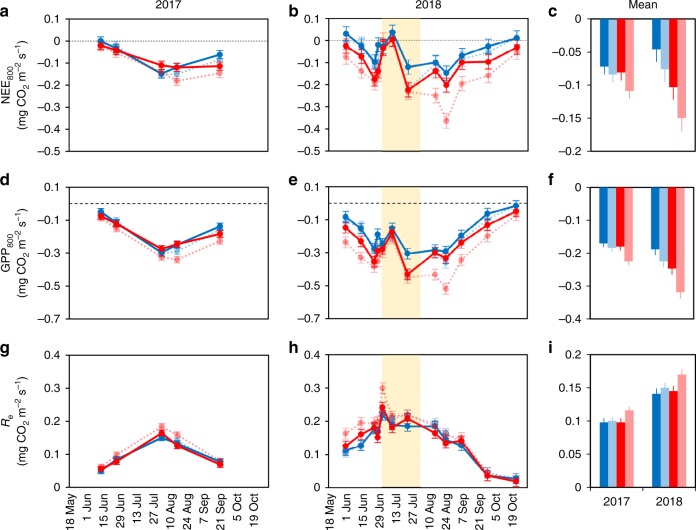
Fig. 1. Warming and reduction in herbivory increase GPP and ecosystem CO2 uptake potential.
Left hand and middle panels show the variation in daytime CO2 fluxes: a, b net ecosystem exchange NEE800, d, e gross primary production GPP800, and g, h ecosystem respiration Re in warmed (red) and ambient (blue) field plots of Subarctic mountain birch forest field layer vegetation (supplemented with cloned birch plantlets) during growing seasons 2017 and 2018 (dots are estimated marginal means ± s.e.m. produced by the fitted statistical model in Table 2; n = 5 field plots). Right hand panels show seasonal means ± s.e.m. of c NEE800, f GPP800, and i Re (means are estimated marginal means produced by the fitted statistical model in Table 2, n = 5 field plots examined over 5 [year 2017] or 12 [year 2018] repeated measures). Light tone dashed lines, symbols, and bars denote plots, where herbivory was reduced using an insecticide. The pale yellow background stripe stands for the period of severe hydrological stress (2nd July–1st August, 2018; see Fig. 3). Source data are provided as a Source Data file.

