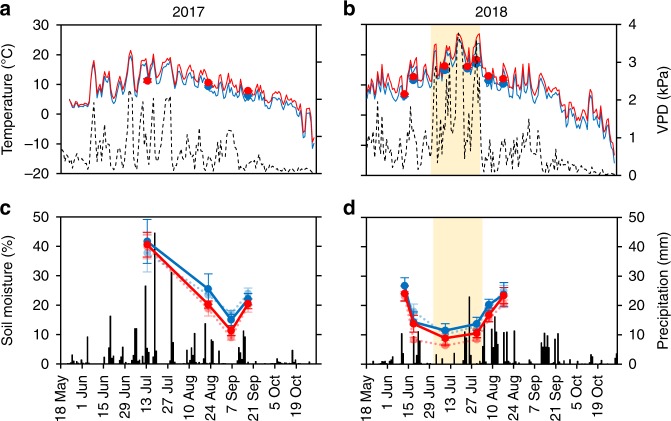
Fig. 3. Abiotic attributes during periods of warming in 2017 and 2018.
a, b Air temperature (solid lines are mean daily temperatures of warmed [red] and ambient [blue] plots, n = 3 field plots), soil temperature (dots are mean ± s.e.m. of warmed [red] and ambient [blue] plots, n = 10 field plots, each examined through 3–5 within-plot measurements) and daily maximum of atmospheric water vapor pressure deficit (VPD; dashed black line); c, d soil moisture (dots are means ± s.e.m. of warmed [red] and ambient [blue] plots, light tone dashed lines and symbols denote plots, where herbivory was reduced using insecticide; n = 5 field plots, each examined through 3–5 within-plot measurements) and daily precipitation (thin black bars). Precipitation and VPD data are from the Kevo weather station (Finnish Meteorological Institute), located 200 m from the experimental site. The pale yellow background stripe stands for the period of severe hydrological stress (2nd July–1st August, 2018). Source data are provided as a Source Data file.

