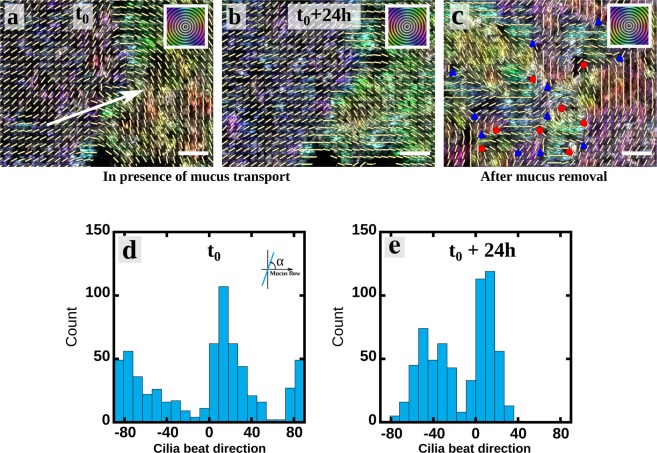
Figure 1.
Mucus transport reorients the beating direction of cilia. (a,b) Orientation maps of beating cilia at 24 h interval while some mucus is transported above. The colors code for the direction of beating according to the orientation scale on the top right hand corner. The director field of the beating direction is plotted as an overlay and is averaged in boxes of 5 μm × 5 μm (~ size of a ciliated cell). The white arrow indicates the averaged direction of the mucus transport in the considered field and is determined from Movie S1. Within 24 hours some reorientations occur, in particular on the right-hand side of the image, and the beating direction can rotate up to 30–35°. (c) Orientation map of beating cilia 3 days after washing out the mucus with culture medium. The field of view is the same than in a & b. Colored triangles and circles indicate discontinuities in the director field. Scale bars are 20 μm. The three field of views are representative of the whole culture chamber. The movie of the beating cilia corresponding to the three panels is Movie S2. (d,e) Angle distributions of ciliary beats corresponding to the figures (a and b) respectively. The 0° orientation corresponds to the mucus flow direction. In presence of a transported mucus above the cilia, we observe a dynamic reorientation of the ciliary beat directions. Over 24 h the two peaks of the distribution get more narrow and are shifted toward the direction of the mucus flow measured from Movie S1.

