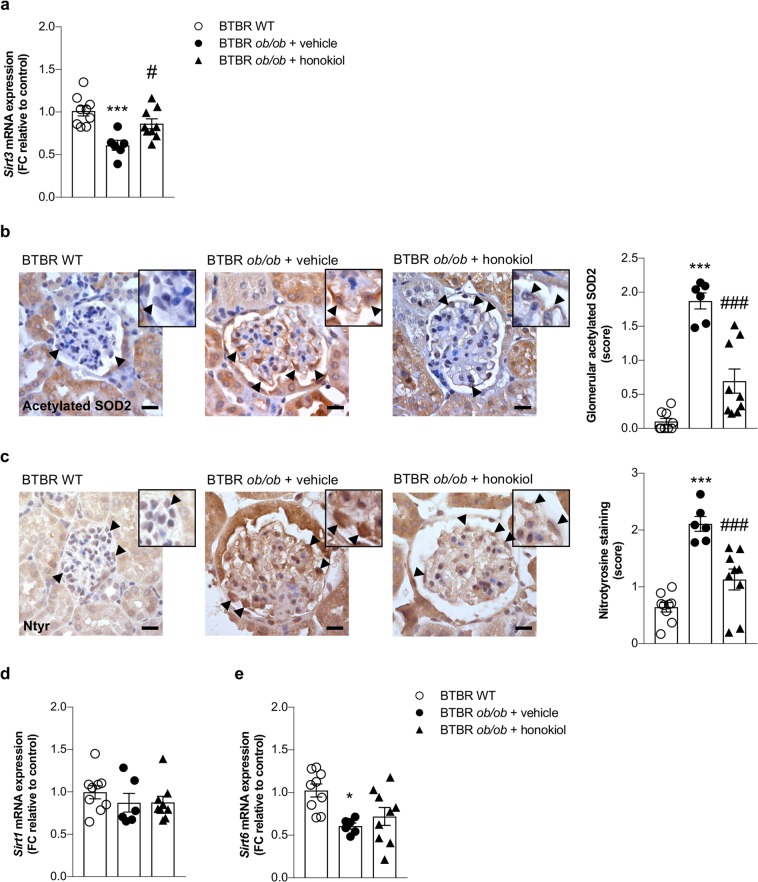
Figure 1.
Reduction of renal expression and activity of Sirt3 paralleled with an increase of ROS production in diabetic mice. (a) qRT-PCR analysis of Sirt3 mRNA levels at 14 weeks of age in kidney of BTBR wild-type (WT) mice (n = 9) and BTBR ob/ob mice treated with vehicle (n = 6) or honokiol (n = 9) from 8 weeks of age. (b) Representative images and quantification of glomerular acetylated SOD2 staining in BTBR WT mice (n = 9) and in BTBR ob/ob mice treated with vehicle (n = 6) or honokiol (n = 9) at 14 weeks of age. Insets show acetylated SOD2 in podocytes of WT and diabetic mice (arrowheads). Scale bars: 20 μm. (c) Representative images and quantification of glomerular nitrotyrosine staining in BTBR WT mice (n = 9) and in BTBR ob/ob mice treated with vehicle (n = 6) or honokiol (n = 9) at 14 weeks of age. Insets show nitrotyrosine staining in podocytes of WT and diabetic mice (arrowheads). Scale bars: 20 μm. (d,e) qRT-PCR analysis of Sirt1 (d), and Sirt6 (e) mRNA levels in kidney of BTBR WT mice (n = 9) and BTBR ob/ob mice treated with vehicle (n = 6) or honokiol (n = 9) at 14 weeks of age. Data are mean ± SEM and were analyzed by one-way ANOVA followed by Tukey’s multiple comparisons test, *p < 0.05, ***p < 0.001 vs BTBR WT mice; #p < 0.05, ###p < 0.001 vs BTBR ob/ob + vehicle.

