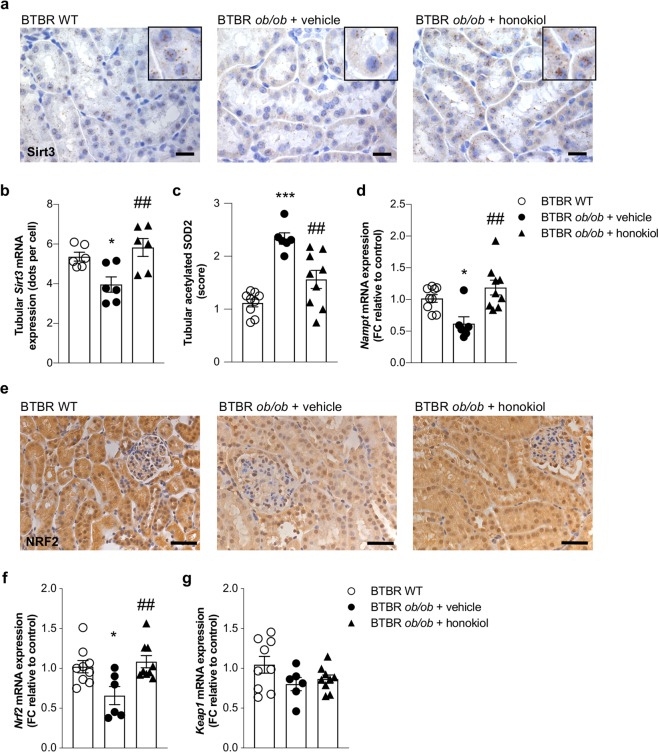
Figure 5.
Glomerular SIRT3 activation is associated with enhanced tubular Sirt3 expression. (a,b) Representative images (a) and quantification (b) of in situ hybridization for Sirt3 in kidney cortex from BTBR WT mice and BTBR ob/ob mice treated with vehicle or honokiol at 14 weeks of age. Scale bars: 20 μm. Insets show the localization of Sirt3 in tubular cells. Image-based quantitative software analysis was performed to evaluate tubular expression of Sirt3. Fiji Image J software (https://imagej.net/Fiji) was used for the quantification of the number of Sirt3 mRNA dots (representing single mRNA molecules). Orbit Image analysis software (http://orbit.bio) was used to count the number of cells. Sirt3 mRNA levels were expressed as average number of dots per cell. (c) Quantification of tubular acetylated SOD2 staining in BTBR WT mice (n = 9) and in BTBR ob/ob mice treated with vehicle (n = 6) or honokiol (n = 9) at 14 weeks of age. (d) qRT-PCR analysis of Nampt mRNA levels in kidney of BTBR WT mice (n = 9) and BTBR ob/ob mice treated with vehicle (n = 6) or honokiol (n = 9). (e) Representative images of NRF2 expression in BTBR WT mice (n = 9) and in BTBR ob/ob mice treated with vehicle (n = 6) or honokiol (n = 9) at 14 weeks of age. Scale bars: 50 μm. (f,g) qRT-PCR analysis of Nrf2 (f) and Keap1 (g) mRNA levels in kidney of BTBR WT mice (n = 9) and BTBR ob/ob mice treated with vehicle (n = 6) or honokiol (n = 9). Data are mean ± SEM and were analyzed by one-way ANOVA followed by Tukey’s multiple comparisons test, *p < 0.05, ***p < 0.001 vs BTBR WT mice; ##p < 0.01 vs BTBR ob/ob + vehicle.

