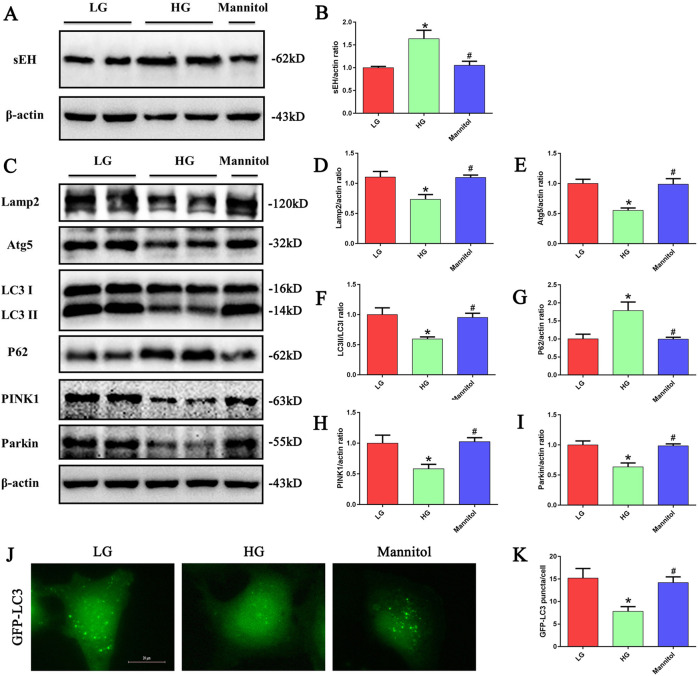
Fig. 1. HG treatment increased sEH expression and induced impaired autophagy in HK-2 cells.
a Western blot analysis of sEH expression in HK-2 cells treated with LG, HG or Mannitol for 24 h. b Densitometric analysis of sEH. (n = 3, *P < 0.05 vs. LG, #P < 0.05 vs. HG.) c Western blot analysis of Lamp2, Atg5,LC3-II/LC3-I, p62, PINK1and Parkin expression in HK-2 cells treated with LG, HG or Mannitol for 24 h. d–i Densitometric analysis of Lamp2, Atg5,LC3-II/LC3-I, p62, PINK1 and Parkin (n = 3, *P < 0.05 vs. LG, #P < 0.05 vs. HG). j HK-2 cells transfected with GFP-LC3 were treated with LG, HG or Mannitol for 24 h, and then observed for the change of green fluorescence using a fluorescence microscope. k Quantification of the number of GFP-LC3 dots in HK-2 cells (n = 5, *P < 0.05 vs. LG, #P < 0.05 vs. HG).

