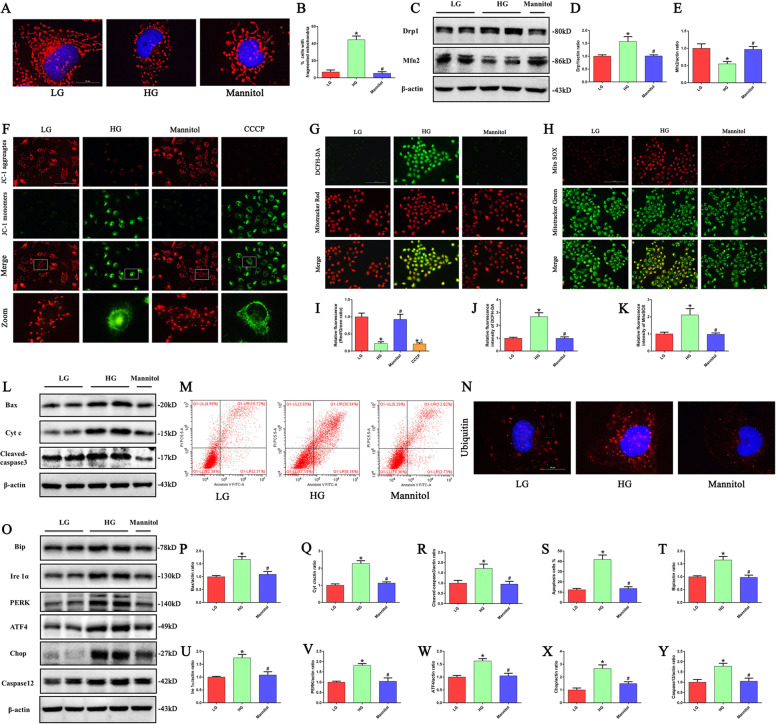
Fig. 2. HG induced mitochondrial damage, ROS generation, ER stress, and apoptosis in HK-2 cells.
a Representative images of MitoTracker Red staining showing the mitochondrial morphology in HK-2 cells treated with LG, HG or Mannitol for 24 h. b Quantification of percentage of HK-2 cells with fragmented mitochondria (n = 4, *P < 0.05 vs. LG, #P < 0.05 vs. HG). c Western blot analysis of Drp1, Mfn2 in HK-2 cells treated with LG, HG or Mannitol for 24 h. d, e Densitometric analysis of Drp1and Mfn2 (n = 3, *P < 0.05 vs. LG, #P < 0.05 vs. HG). f Representative images of JC-1 staining showing the mitochondrial membrane potential in HK-2 cells treated with LG, HG, Mannitol or CCCP. g HK-2 cells were treated with LG, HG or Mannitol for 24 h, and then incubated with DCFH-DA and MitoTracker Red. h HK-2 cells were treated with LG, HG or Mannitol for 24 h, and then incubated with Mito SOX and MitoTracker Green. i–k Quantification of the fluorescence intensity of JC-1, DCFH-DA and Mito SOX staining in figures f–h (n = 3, *P < 0.05 vs. LG, #P < 0.05 vs. HG). l Western blot analysis of Bax, Cyt c and cleaved-caspase3 in HK-2 cells treated with LG, HG or Mannitol for 24 h. m Flow cytometry analysis of the cell apoptotic rate. (n) Representative images of immunofluorescence staining of ubiquitin in HK-2 cells. o Western blot analysis of Bip, Ire1α, PERK, ATF4, Chop, Caspase12 in HK-2 cells treated with LG, HG or Mannitol for 24 h. p–r Densitometric analysis of Bax, Cyt c and cleaved-caspase3 in figure l (n = 3, *P < 0.05 vs. LG, #P < 0.05 vs. HG). s Quantification of the cell apoptotic rate in figure m (n = 3, *P < 0.05 vs. LG, #P < 0.05 vs. HG). t–y Densitometric analysis of Bip, Ire1α, PERK, ATF4, Chop, Caspase12 in figure o (n = 3, *P < 0.05 vs. LG, #P < 0.05 vs. HG).

