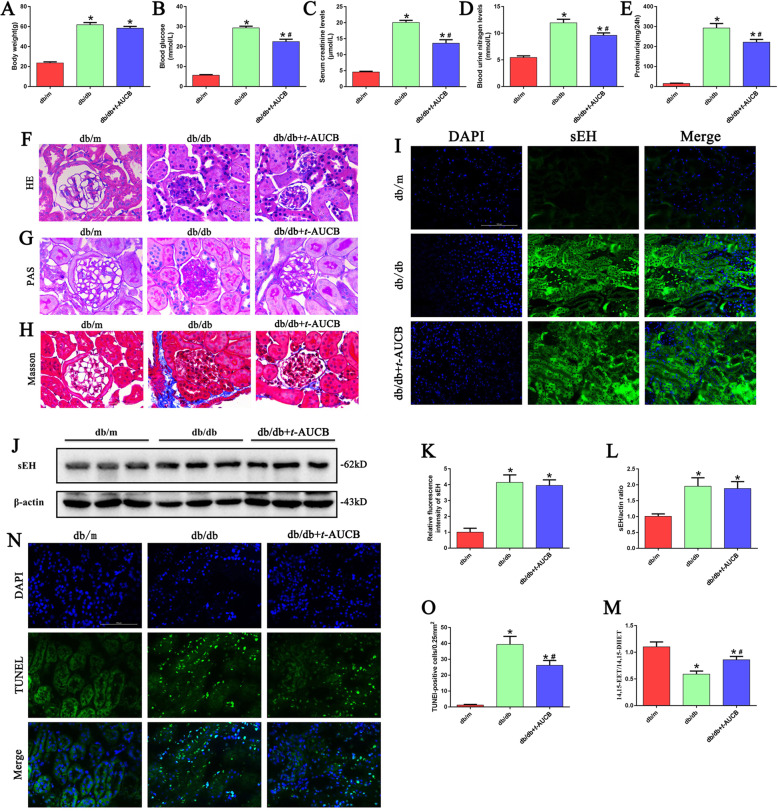
Fig. 5. Effect of sEH inhibitor t-AUCB on renal functional and morphologic characteristics in db/db mice.
The changes of body weight (a), blood glucose levels (b), serum creatinine (SCr) levels (c), blood urea nitrogen (BUN) levels (d), urine protein levels (e) in db/m, db/db and db/db mice treated with t-AUCB. f–h Kidney sections stained with H&E, PAS, MassonTrichrome. i Representative images of immunofluorescence staining of sEH in kidney tissues. j Western blot analysis of sEH expression in kidney tissues. k Quantification of the fluorescence intensity of sEH in figure i. l Densitometric analysis of sEH expression in figure j. m ELISA kit analysis of 14,15-EET to 14,15-DHET ratios in the urine of db/m, db/db and db/db mice treated with t-AUCB. n–o Representative images and quantification of TUNEL staining of kidney tissues. *P < 0.05 vs. db/m, #P < 0.05 vs. db/db.

