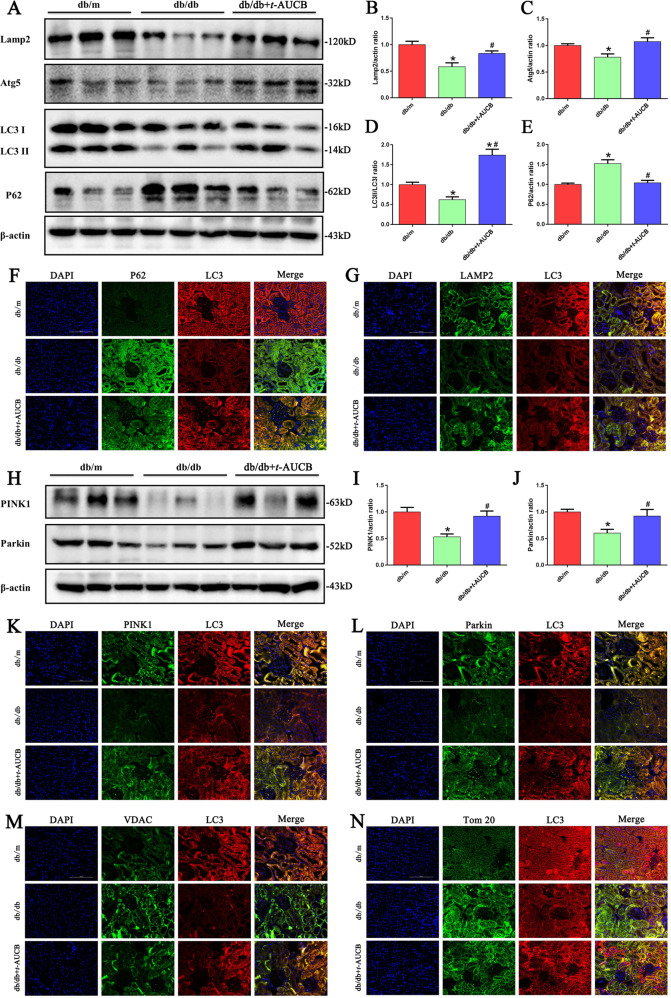
Fig. 6. Inhibition of sEH with t-AUCB restored autophagy flux and mitophagy in tubules of db/db mice.
a Western blot analysis of Lamp2, Atg5, LC3-II/LC3-I and p62 expression in kidney tissues. b–e Densitometric analysis of Lamp2, Atg5, LC3-II/LC3-I and p62 expression. f–g Representative images of immunofluorescence double labeling of P62 and LC3, or Lamp2 and LC3 in different kidney tissues. h Western blot analysis of PINK1and Parkin expression in kidney tissues. i, j Densitometric analysis of PINK1 and Parkin expression. k–n Representative images of immunofluorescence double labeling of PINK1 and LC3, Parkin and LC3, VDAC and LC3,Tom20 and LC3 in different kidney tissues. *P < 0.05 vs. db/m, #P < 0.05 vs. db/db.

