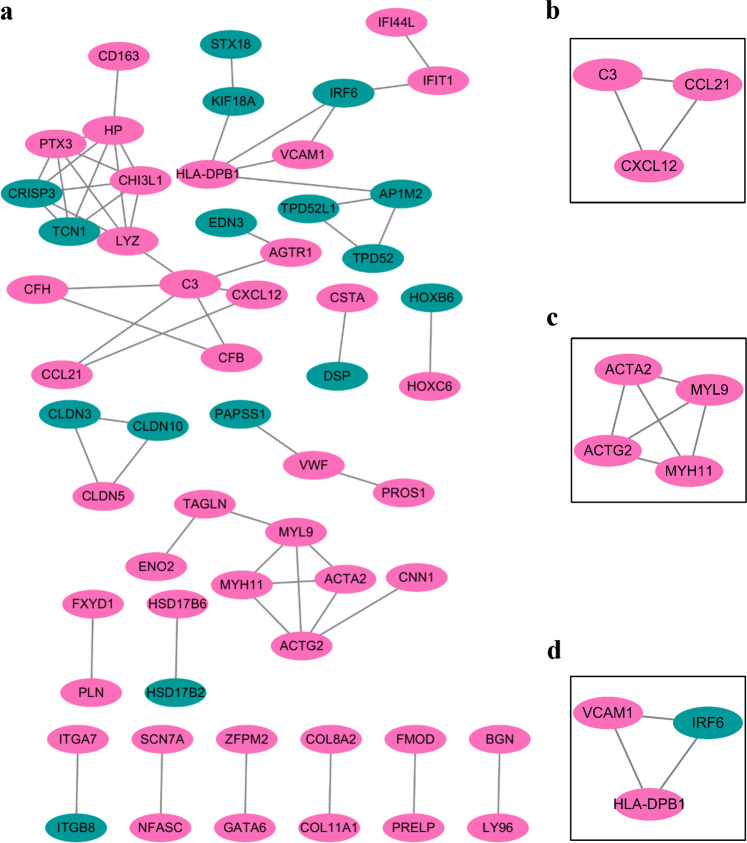
Figure 4.
PPI network analysis of DEGs in endometriosis. Protein-Protein Interaction Network of DEGs from all datasets generated in String.db (v. 11) and visualised in Cytoscape (v. 3.7.1). (a) PPI network analysis of DEGs. (b–d) Representative local association graphs in PPI network analysis. Nodes indicate proteins/genes and lines indicate protein-protein interaction. Pink indicates up-regulation and green indicates down-regulation.

