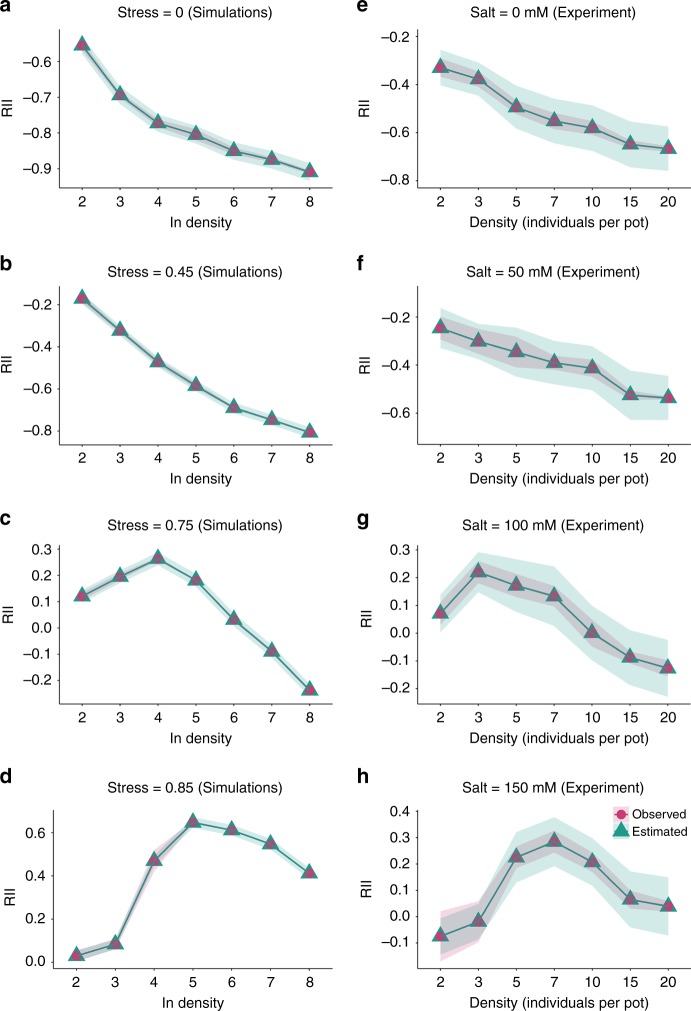
Fig. 4. Bayesian estimates and observed plant–plant interactions.
a–d Bayesian estimates (with 95% credible set) and observed average index (RII; with 95% confidence interval) along a density gradient at each stress level in the simulations (n = 5 independent samples in model simulations for the density gradient from two to eight at each stress level). e–h experimental data (for the density gradient from 2 to 20 plants per pot, nsalt_0 = 25, 29, 17, 16, 15, 15 and 16 independent pots, respectively; nsalt_50 = 20, 25, 13, 17, 16, 13, 16; nsalt_100 = 30, 26, 15, 12, 14, 14, 13; nsalt_150 = 29, 30, 15, 16, 17, 12, 11). Circles and represent observed values while triangles and lines represent Bayesian estimates. Source data are provided as a Source Data file.

