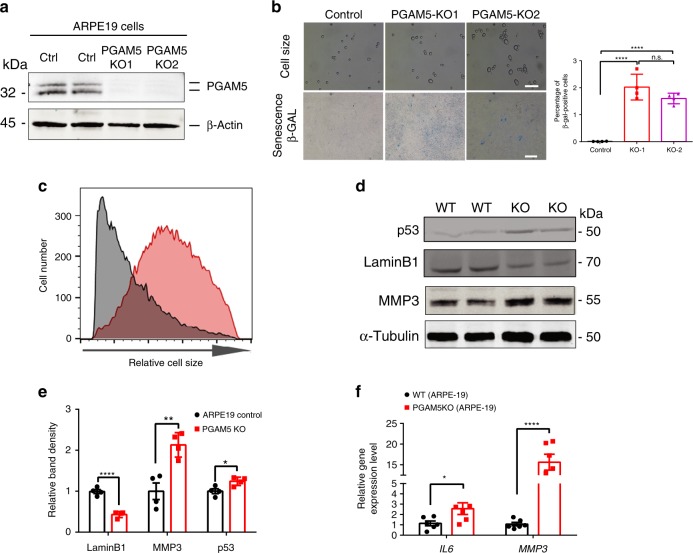
Fig. 2. Cellular senescence induced by PGAM5 deletion in vitro.
a Western blot confirming PGAM5 deletion in ARPE-19 cells using CRISPR/Cas9 technology. β-Actin was used as a loading control. n = 3. b Top panel: cell size change detected in PGAM5−/− ARPE-19 cells after 8 weeks culture and trypsinization; bottom panel: SA-β-gal activity change detected in PGAM5−/− ARPE-19 cells after 8 weeks culture; quantification of β-gal staining was shown in the bar graph (right panel). n = 4. Scale bar = 100 µm (up panels) or 500 µm (down panels). ****p < 0.0001, one-way ANOVA Tukey’s multiple comparisons test. Error bars, mean ± s.d. c Relative cell size distribution in WT and PGAM5−/− ARPE-19 cells after 8 weeks culture as measured by flow cytometry. X axis is FSC-A, which reflects cell size. n = 3. d Western blots confirming p53 and MMP3 upregulation and Lamin B1 downregulation PGAM5−/− AREP-19 cells after 8 weeks culture. α-Tubulin was used as a loading control n = 4. e Quantification for the bands density in d. n = 4, ****p < 0.0001, **p = 0.0041, *p = 0.0207, two-tailed unpaired t-tests; error bars, mean ± s.d.; f IL6, MMP3 mRNA level as measured by qRT-PCR in WT and PGAM5−/− ARPE-19 cells after 8 weeks culture. n = 6, *p < 0.05, ****p < 0.0001, two-tailed unpaired t-tests. Error bars, mean ± s.e.m. For assays in the figure, n represents the number of biologically independent experiments. Images were captured under same settings, and representative images were shown. Source data are available as a Source Data file.

