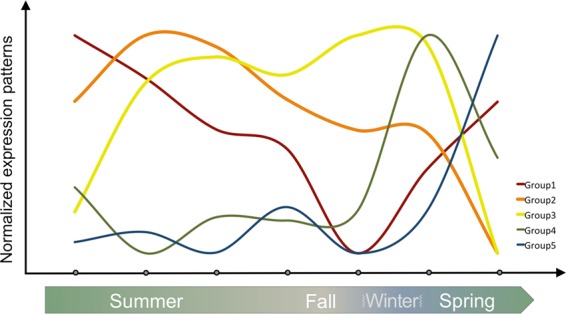
Figure 5.

Gene expression patterns indicate a time series of chromatin organization events. This schematic serves as an explanatory diagram for the patterns observed in the heat map (see Fig. 4 for details). The thickness of the line reflects the number of genes associated with each of the major groups highlighted in Fig. 4. Note that little chromatin modification activity is evident at the final time-point (mature buds, just prior to anthesis).
