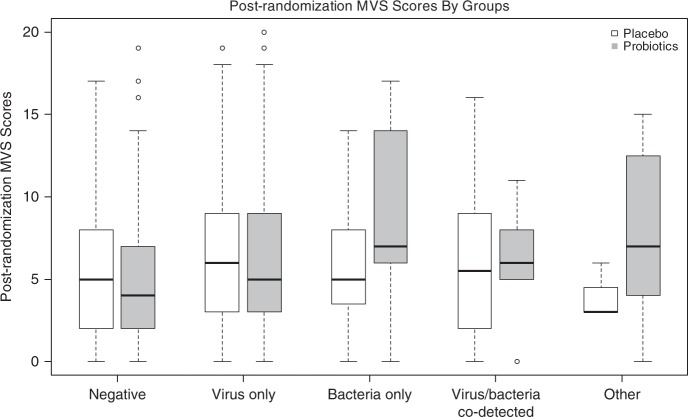
Fig. 2. Post randomization disease severity (Modified Vesikari Scale scores) based on pathogen identified, compared between probiotic and placebo groups.
Boxplots of post-randomization modified Vesikari scale cores by treatment and pathogen groups (Tested negative: placebo n = 160, probiotics n = 139; virus only: placebo n = 219, probiotics n = 232; bacteria only: placebo n = 20, probiotics n = 17; virus/bacteria co-detection: placebo n = 6; probiotics n = 13; Other type detected including parasite only and virus/parasite co-detection: placebo n = 3, probiotics n = 7). In the box plot, the line that divides the box into two parts represents the median of the data; the upper and lower bounds of the box represent the 25% and 75 percentiles, respectively. The lower whiskers represent the 25%ile-(1.5× IQR) and the upper whiskers represent the 75%ile-(1.5× IQR). The dots beyond the whisker represents outliers of values within the dataset. Source data are provided as a Source Data file.

