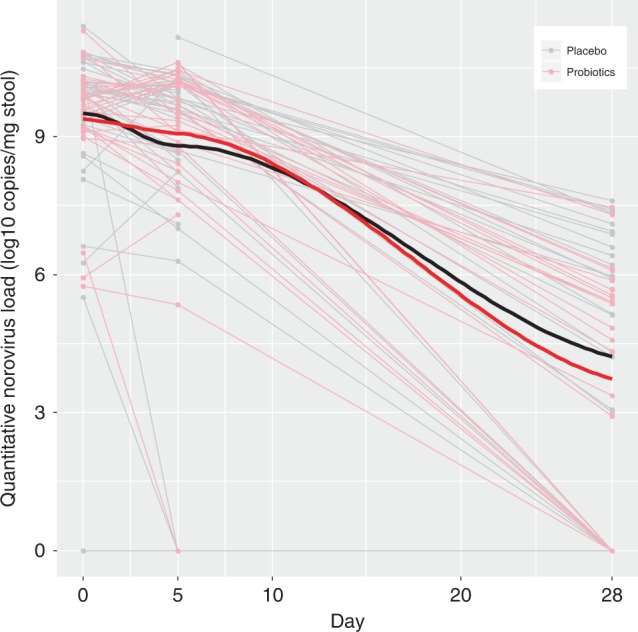
Fig. 4. Change in norovirus viral load quantity in stool over time, compared between probiotic and placebo groups.

Stool Log10 transformed copies of norovirus by treatment group [probiotic (N = 34) vs. placebo (N = 47)] across time (in days) following randomization on the x-axis. Thin light gray lines refer to patients provided placebo, this red lines refer to those provided probiotic; thick black and red lines to locally weighted smoothing lines respectively The two-sided P-value represents the result of a linear mixed effect model with random intercepts (subjects random effect) comparing placebo (reference group) vs. probiotic on viral load, including time and treatment group variables, and an interaction term for the latter two. Source data are provided as a Source Data file. Norovirus (mean difference: 0.16; 95% CI: −0.81, 1.14; P = 0.74).
