
Figure 3.
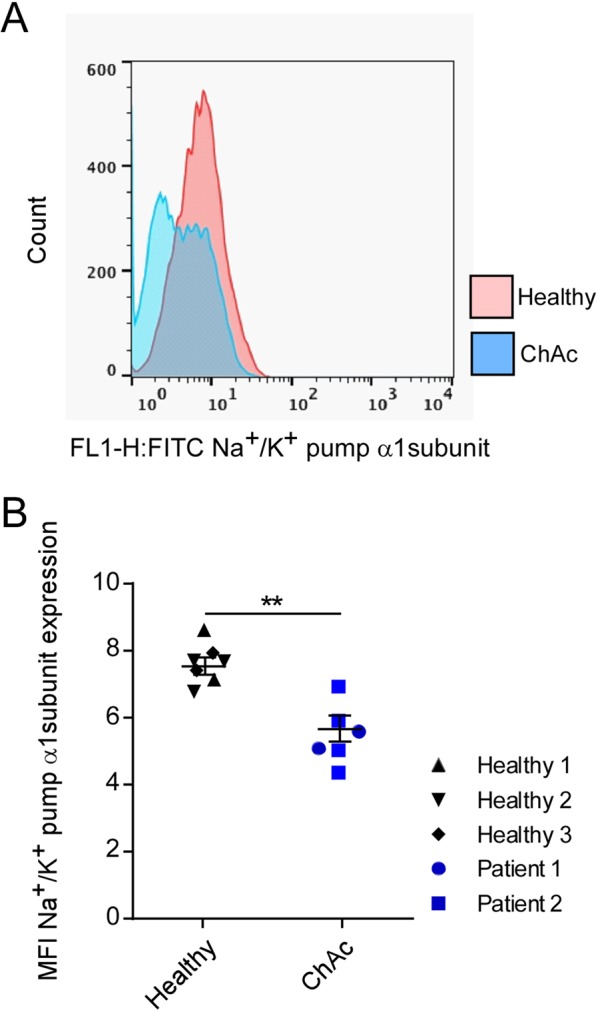
Na+/K+ α1-subunit protein levels in neurons generated from healthy volunteers and ChAc patients. (A) Original histogram of Na+/K+ α1-subunit protein abundance determined by flow cytometry in neurons generated from healthy volunteers (red) and ChAc patients (blue). (B) Means ± SEM (n = 6-7) of Na+/K+ α1-subunit protein abundance (mean fluorescence intensity; MFI) determined by flow cytometry in neurons generated from healthy volunteers (black diamond, triangle, reverse triangle) and in neurons generated from ChAc patients (blue circle, square). Data was generated from two independent culture experiments. **(p < 0.01) indicates significant difference between two groups, unpaired t-test.