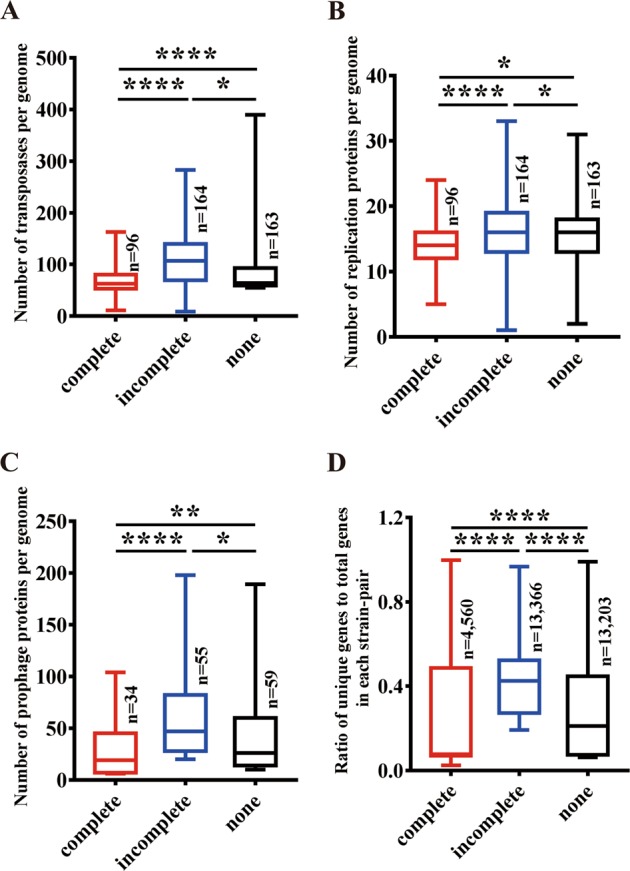
Fig. 5. Distribution of mobile genetic elements and unique genes among selected B. cereus group strains.

The MGEs including transposases (a), plasmid replication essential proteins (b), and prophage proteins (c) contents among selected strains with complete, incomplete or no CRISPR-Cas systems are shown. The contents were compared by calculating the numbers of each kind of MGEs per genome of each group. d The comparison of unique gene diversity value among B. cereus group strains. Unique gene diversity was compared by calculating the rate of unique genes per genome for all the selected genomes. The significance of the differences among samples was evaluated using two sample Wilcoxon–Mann–Whitney test at, p < 0.0001 (****) p < 0.001 (***), p < 0.01 (**) and p < 0.05 (*).
