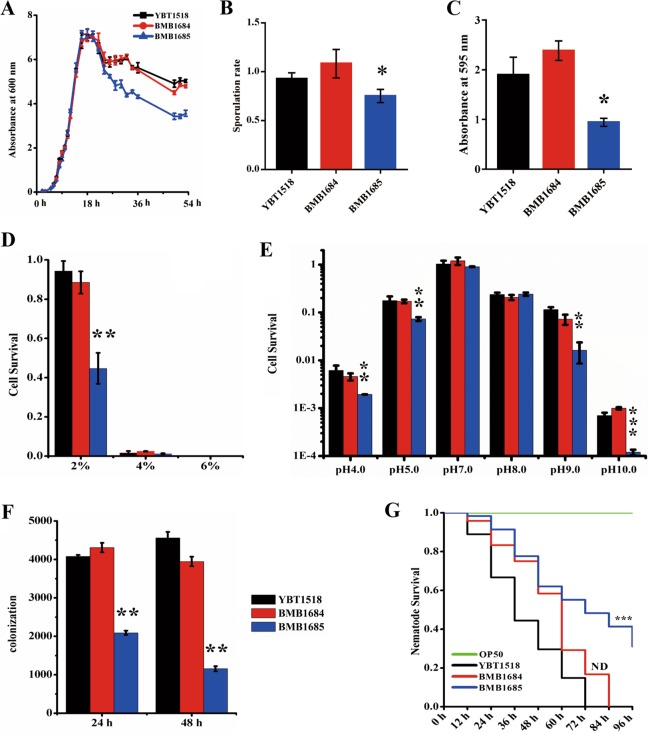
Fig. 7. Impact of active CRISPR-Cas system on the adaptation to different environmental stresses and into its nematode host.
a Growth curve of B. thuringiensis transformed with subtype I-C CRISPR-Cas system (BMB1685) or same B. thuringiensis strain without transformation (YBT-1518) or transformed with empty vector (BMB1684). The optical absorbance value at 600 nm of these B. thuringiensis strains grown in LB medium was analyzed successively from 0 to 54 h. b Sporulation rate of bacteria. Sporulation rates were calculated by the CFU of spore-containing aliquots heated at 80 °C for 10 min divide by CFU of the aliquots that were kept on ice before growing in LB-agar plates for 24 h at 28 °C. c Biofilm formation ability of bacteria. The data are expressed as the absorbance at 595 nm of wells treated with different B. thuringiensis strains after staining. d Salt tolerance of bacteria. The data are expressed as survival rate of the different B. thuringiensis strains exposed to high-salt environments containing 2%, 4 and 6% NaCl. e pH tolerance of bacteria. The data are expressed as survival rate of B. thuringiensis strains exposed to different pH environments. In all assays, BMB1684 strain containing empty pBAC44 vector was used as control. f Colonization of the different B. thuringiensis strains in C. elegans. A total of 103 spores of each B. thuringiensis strain were added to 30–50 L4 stage N2 nematodes as the only food source. The colonies of B. thuringiensis were counted after analyzing the samples isolated from infected worms after 24 and 48 h. The BMB1684 strain containing empty pBAC44 vector was used as control. g Life-span assay of C. elegans feeding with B. thuringiensis with or without of subtype I-C CRISPR-Cas system. The survival rates of L4 stage N2 worms (50–100 for each well) fed with spore/crystal mixture of the different B. thuringiensis strains were calculated after different incubation times. The BMB1684 strain and standard food E. coli OP50 were used as controls. The error bars represent the standard deviations from the mean values of three independent experiments. The differences of recombinant strains against YBT-1518 wild type was evaluated using two-sample t-test. A double asterisk indicates p < 0.01, single asterisk indicates p < 0.05, lacking of any symbol and ND indicates no significant difference.

