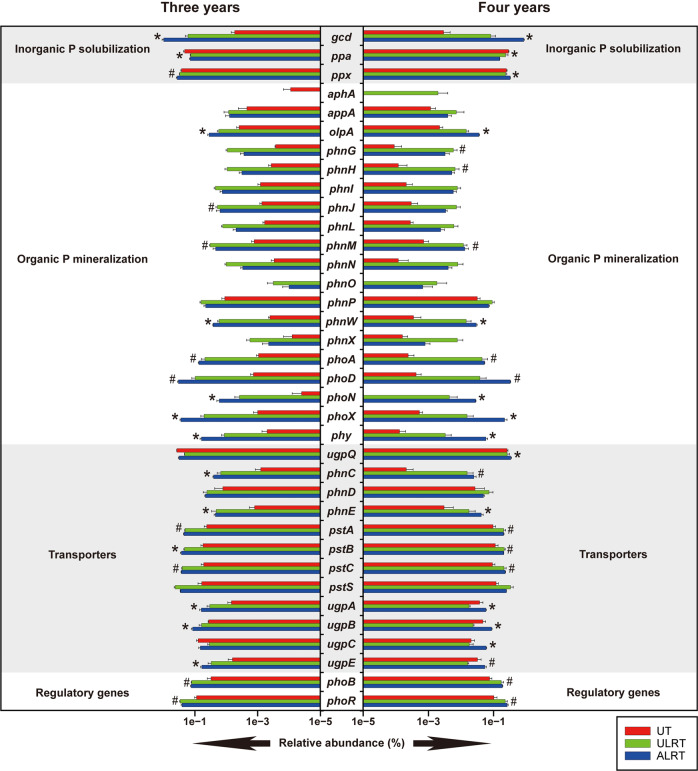
Fig. 1. The effects of ecological restoration on the relative abundances of genes responsible for soil microbial P-cycling potential.
Data (n = 3; mean ± S.E.) of soil samples collected at 3 and 4 years after the initiation of the ecological restoration were presented in the left and right panel, respectively. UT, ALRT, and ULRT represent soil samples collected from unrestored mine tailings, the amended layer (0–10 cm) of the restored mine tailings and the unamended layer (11–20 cm) of the restored mine tailings, respectively. Asterisk symbol indicates significant (P < 0.05, LSD) differences between UT and ALRT (i.e. ALRT > UT). Hash symbol indicates significant differences between the three types of soil samples (i.e. ALRT > ULRT > UT).

