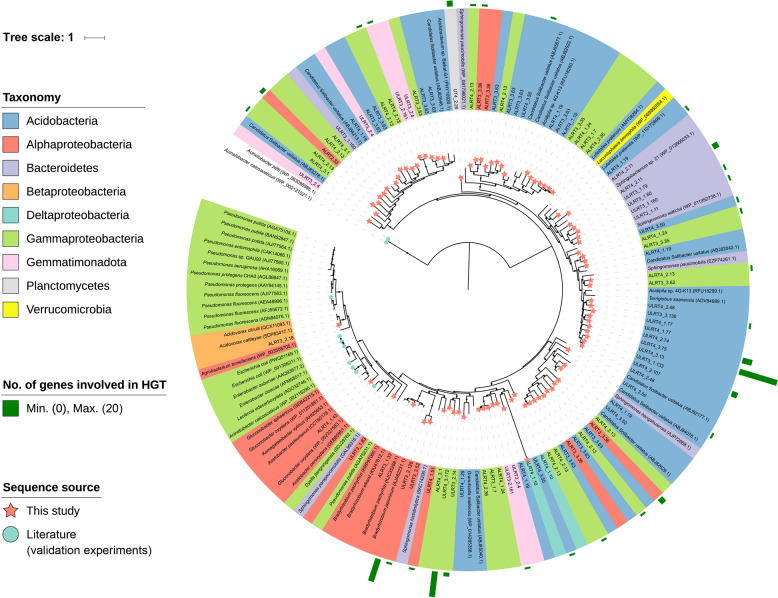
Fig. 4. Phylogenic analysis of quinoprotein glucose dehydrogenases (GCDs).
Bootstrap values were based on 100 replicates, and only bootstrap values higher than 70% are shown with black circles. The accession number of each published protein is shown in parenthesis. The new GCDs recovered in our study are indicated with red stars. The published GCDs with functional validation by experimentation in the literature are indicated with green circles. Numbers of genes annotated as mobile genetic elements involved in horizontal gene transfer (HGT) on the same scaffolds with gcd genes are indicated with green bars outside the phylogenetic tree. Details on mobile genetic elements involved in HGT were provided in Table 2 and Table S7.

